
Research Data Note
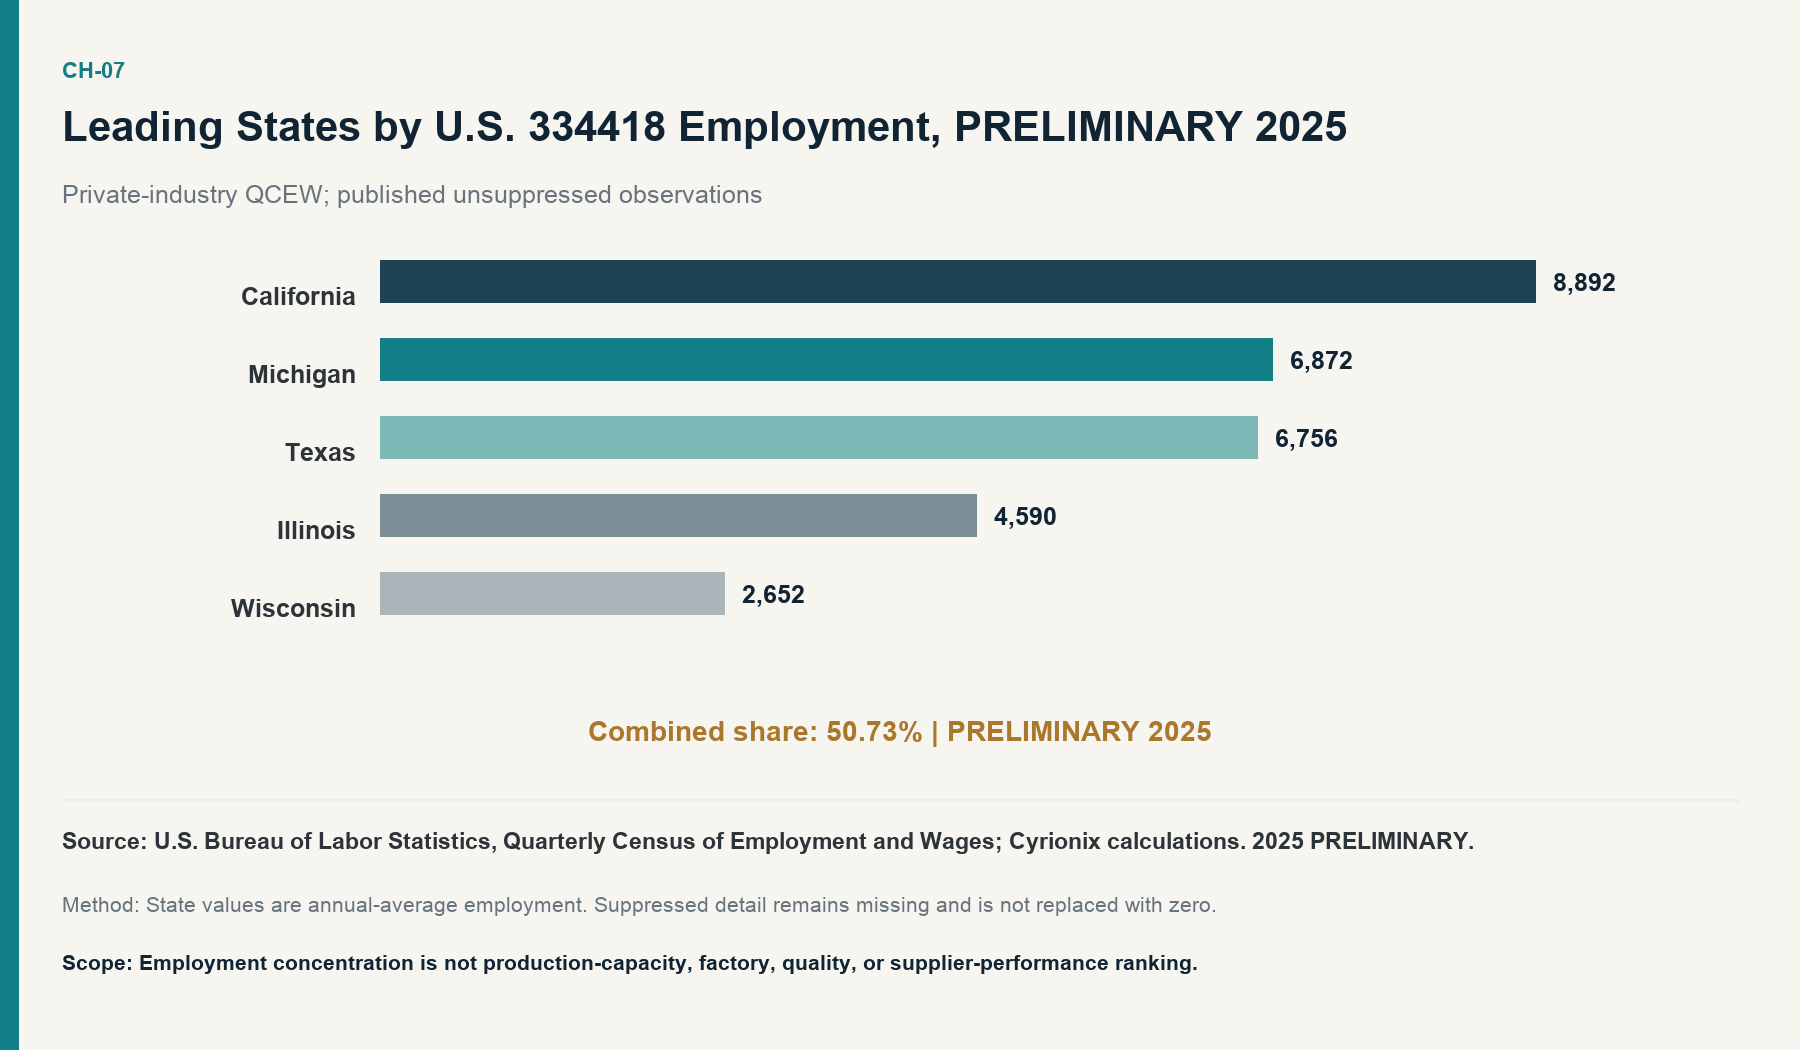
State footprint read: For PCBA manufacturing by state in 2025, the largest published PRELIMINARY QCEW employment observations were California, Michigan, Texas, Illinois, and Wisconsin. Together they accounted for 50.73% of national private-industry U.S. NAICS 334418 employment. This is an employment map, not a supplier ranking.
Data notes
Publisher
Cyrionix
Geography
United States / published state observations
Primary dataset
BLS Quarterly Census of Employment and Wages annual averages
Industry
NAICS 334418, Printed Circuit Assembly (Electronic Assembly) Manufacturing
Metric
Private-industry annual-average employment, PRELIMINARY 2025
Calculation
State employment divided by national PRELIMINARY 2025 employment of 58,671
Evidence cutoff
August 18, 2026
Parent research
North American PCB & PCBA Sourcing in 2026
Leading published state observations
| State | PRELIMINARY 2025 employment | Share of national PRELIMINARY 2025 employment |
|---|---|---|
| California | 8,892 | 15.16% |
| Michigan | 6,872 | 11.71% |
| Texas | 6,756 | 11.52% |
| Illinois | 4,590 | 7.82% |
| Wisconsin | 2,652 | 4.52% |
| Five states combined | 29,762 | 50.73% |
| United States | 58,671 | 100.00% |
Source: U.S. Bureau of Labor Statistics, QCEW; Cyrionix calculations. State rows are published unsuppressed observations. All 2025 QCEW values are PRELIMINARY.
What the data shows
The leading published observations span several U.S. regions rather than one single cluster. California accounted for 15.16% of national PRELIMINARY 2025 employment in the covered industry. Michigan and Texas each represented a little more than 11%, followed by Illinois at 7.82% and Wisconsin at 4.52%. Together the five states had 29,762 employees out of the national PRELIMINARY 2025 total of 58,671.
The combined share was calculated as `(8,892 + 6,872 + 6,756 + 4,590 + 2,652) / 58,671 × 100 = 50.726935%`, reported as 50.73%. Individual shares use the same national denominator and are rounded to two decimals. Because the table is based on annual-average employment, it describes a workforce footprint across the year rather than employment on one date.
Geographic concentration can matter when a buyer maps where covered manufacturing labor is reported, but it does not answer which supplier can build a particular design. A U.S. PCB assembly workforce by state view is useful context for discovery and resilience planning. State rank and supplier fit are different questions. A lower-ranked state can contain a highly suitable supplier, and a leading state can contain establishments whose processes, lot sizes, or certifications do not match a buyer’s needs.
How to use the state footprint
The state view can help a team identify where documented industry employment is concentrated and where regional supplier discovery or resilience work may warrant attention. It can also provide context for workforce-development, logistics, or geographic-risk discussions when the NAICS 334418 state employment boundary is appropriate.
The next step is not to select the highest-ranked state. It is to identify actual candidate establishments and validate capability, ownership, production location, tooling, certifications, quality history, current workload, and continuity plans. Public employment data can frame that search but cannot complete it.
What the data does not show
Employment is not capacity. The state values do not measure installed lines, utilization, throughput, automation, layer capability, assembly complexity, available schedule, or output.
This is not a factory ranking. QCEW establishments are reporting units, and this note does not convert employee counts into factory counts. It also does not rank quality, yield, on-time delivery, lead time, cost, certifications, engineering support, or suitability.
Suppressed or absent detail is not zero. The ranking uses published unsuppressed state rows. Disclosure treatment can limit what is visible for some geographies, so the table should not be read as a complete supplier census.
Methodology and limitations
Cyrionix selected private-ownership QCEW annual-average employment rows for NAICS 334418 and retained only published state observations. States were ranked by reported PRELIMINARY 2025 employment. The national PRELIMINARY 2025 value of 58,671 is the denominator for every share. Suppressed values remain missing and are not replaced with zero or estimated.
NAICS classifies establishments by primary activity. It does not classify individual products, production lines, or purchase orders. The PRELIMINARY 2025 QCEW release can be revised, and changes in reporting or classification can affect comparisons. This note does not compare state wages, establishments, or output because those would answer different questions and require their own scope controls.
The separate national employment and establishments note owns the 2021-to-PRELIMINARY-2025 trend and the distinction between QCEW and the 2022 Economic Census. Keeping that analysis separate prevents a state ranking from being mistaken for a national capacity estimate.
Primary sources
- U.S. Bureau of Labor Statistics, Quarterly Census of Employment and Wages Annual Averages, private-ownership NAICS 334418 national and state files, PRELIMINARY 2025. QCEW downloadable data.
- U.S. Census Bureau, 2022 NAICS 334418 definition.