
Research Data Note
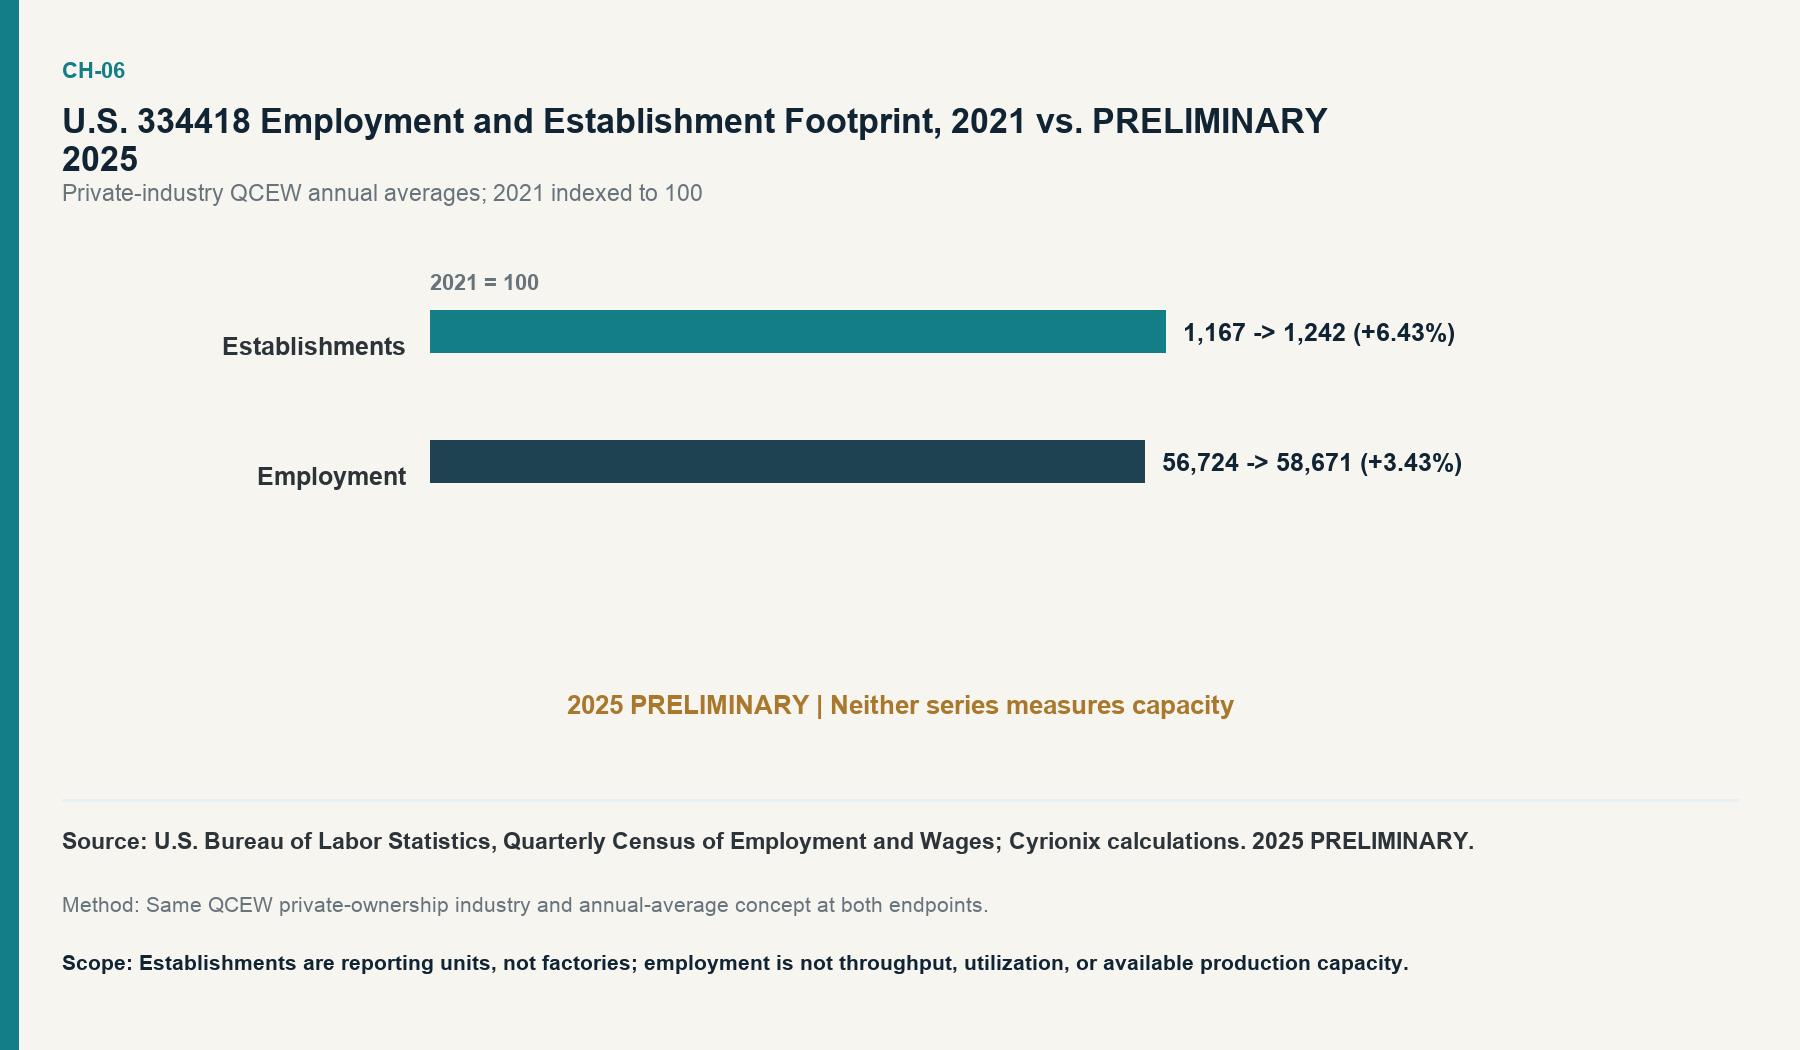
Workforce read: For U.S. PCBA manufacturing employment in 2025, private-industry NAICS 334418 QCEW data reported 58,671 employees and 1,242 establishments in PRELIMINARY 2025 data. The series documents a workforce and reporting-unit footprint; it does not measure open capacity or supplier fit.
Data notes
Publisher
Cyrionix
Geography
United States
Primary dataset
BLS Quarterly Census of Employment and Wages annual averages
Industry
NAICS 334418, Printed Circuit Assembly (Electronic Assembly) Manufacturing
Metric
Private-industry annual-average employment and establishments
Calculation
Percent change from final 2021 to PRELIMINARY 2025 within the same QCEW concept
Evidence cutoff
August 18, 2026
Parent research
North American PCB & PCBA Sourcing in 2026
National workforce and establishment trend
| Metric | 2021 final | PRELIMINARY 2025 | Change, 2021 to PRELIMINARY 2025 |
|---|---|---|---|
| Establishments | 1,167 | 1,242 | +6.43% |
| Employment | 56,724 | 58,671 | +3.43% |
Source: U.S. Bureau of Labor Statistics, QCEW; Cyrionix calculations. All 2025 QCEW values are PRELIMINARY.
What the data shows
The covered national employment footprint increased by 1,947 workers between final 2021 and PRELIMINARY 2025. Over the same endpoints, the establishment count increased by 75 reporting units. The percentage changes are `(1,242 / 1,167 − 1) × 100 = 6.426735%` for establishments and `(58,671 / 56,724 − 1) × 100 = 3.432410%` for employment, reported as 6.43% and 3.43%.
Because the establishment count grew faster than employment, average employment per reporting unit did not necessarily rise. That observation is descriptive only. QCEW cannot explain whether the change came from new firms, additional locations, reclassification, ownership changes, reporting-unit changes, or different employment levels at continuing establishments.
The NAICS boundary is important. Industry 334418 covers establishments primarily engaged in manufacturing printed circuit assemblies, including loading components onto boards or manufacturing and loading printed circuit boards. It supports a documented electronic assembly manufacturing workforce view. It is not a directory of every company capable of PCB assembly, and it does not include an establishment merely because that establishment purchases or uses assemblies.
Separate 2022 structural context
The U.S. Economic Census provides a different official view of the same NAICS industry. For 2022, it reported 891 establishments, 54,438 employees, 35,170 production workers, USD 24.471 billion in value of shipments, USD 17.476 billion in material costs, and USD 7.895 billion in value added.
Those figures are useful as a 2022 structural benchmark, but they are not inserted into the QCEW trend. Economic Census and QCEW establishment concepts and coverage are not interchangeable. The 2022 shipment figure is industry output under that program; it is not market size, demand, current 2026 activity, or a value that can be combined with imports to estimate domestic share.
What the data does not show
Establishments are reporting units, not necessarily factories. A reporting unit does not disclose equipment, clean-room class, process capability, utilization, lot-size fit, ownership of production assets, or available schedule.
Employment is not capacity. A worker count does not measure throughput, installed lines, utilization, yield, technology mix, automation, delivery performance, or capacity available to a buyer. Employment growth does not prove output or capacity growth.
The data also do not rank suppliers or establish quality, price, lead time, certification scope, or suitability for a specific product. Those questions require supplier-specific records.
How to use the footprint measure
The QCEW series is useful for tracking whether the documented covered workforce and reporting-unit footprint is expanding or contracting under a consistent statistical concept. It can support workforce, geographic, and industrial-base questions around NAICS 334418 employment and establishments. It should not be used to award business or infer an available production slot.
A buyer evaluating suppliers still needs a dated capability review: process limits, equipment, staffing by function, test coverage, certifications, quality history, current utilization, and schedule commitments. Those records live at the supplier and program level, outside the QCEW dataset.
Methodology and limitations
Cyrionix selected annual-average private-ownership QCEW rows for the United States and NAICS 334418. The calculation holds geography, industry, ownership, and annual-average concept constant and compares final 2021 with PRELIMINARY 2025. Missing or suppressed records are not converted to zero. The underlying PRELIMINARY 2025 release can be revised.
The Economic Census context is reported separately from QCEW. No attempt is made to reconcile the two establishment totals, calculate productivity from mixed programs, or carry the 2022 output fields forward. The related state note answers where the published PRELIMINARY 2025 employment footprint was concentrated; it does not alter the national trend here.
Primary sources
- U.S. Bureau of Labor Statistics, Quarterly Census of Employment and Wages Annual Averages, private-ownership NAICS 334418 national files, 2021 and PRELIMINARY 2025. QCEW downloadable data.
- U.S. Census Bureau, 2022 Economic Census Manufacturing: General Summary Statistics, national NAICS 334418 row. 2022 Economic Census manufacturing tables.
- U.S. Census Bureau, 2022 NAICS 334418 definition.