
Research Data Note
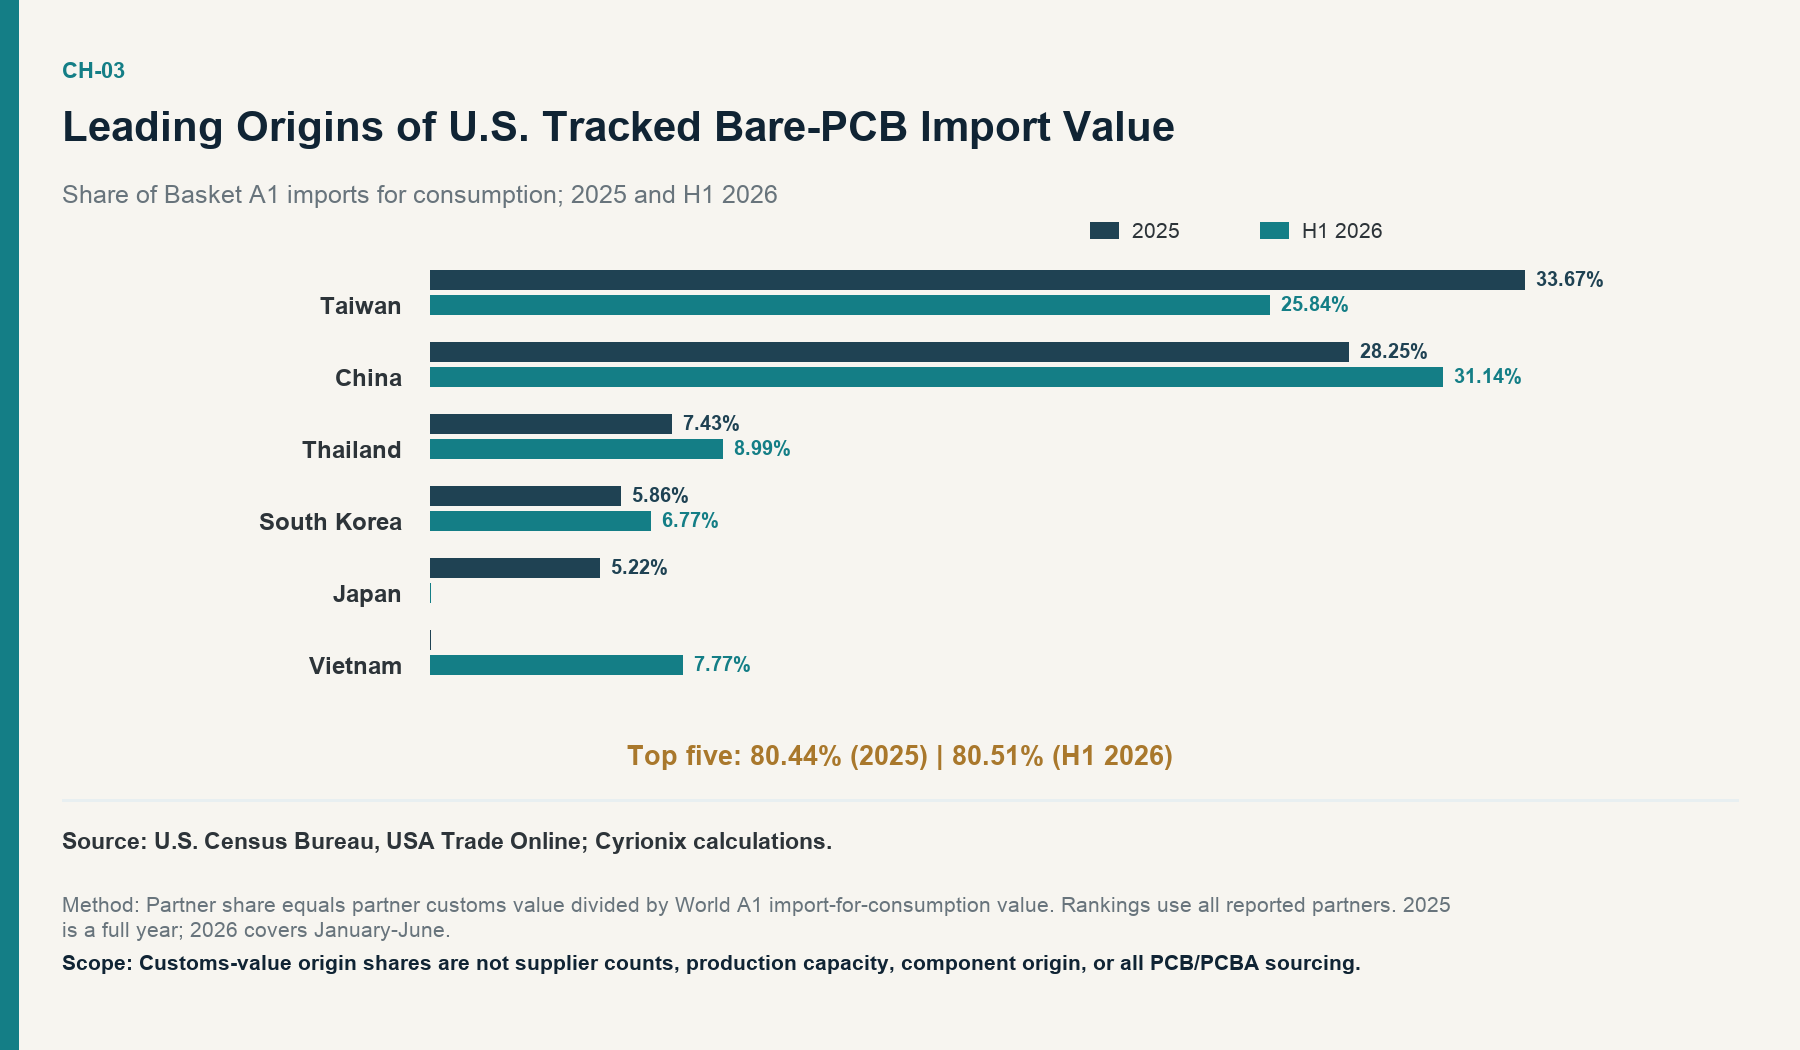
Origin read: For U.S. PCB imports by country in the tracked bare-board basket, Taiwan and China were the two largest 2025 origins. In January–June 2026, China ranked first and Taiwan second. The leading-origin share stayed near 80.5%, while HHI shows the mix was not static.
Data notes
Publisher
Cyrionix
Geography
United States imports / reported origins
Primary dataset
U.S. Census Bureau, USA Trade Online
Classification
Seven validated Basket A1 HTS10 bare printed-circuit lines
Metric
Origin share of import-for-consumption customs value
Calculation
Partner value divided by World value; ranks use all reported partners
Evidence cutoff
August 18, 2026
Parent research
North American PCB & PCBA Sourcing in 2026
Leading origins and concentration
| Origin | 2025 share | H1 2026 share |
|---|---|---|
| Taiwan | 33.67% | 25.84% |
| China | 28.25% | 31.14% |
| Thailand | 7.43% | 8.99% |
| South Korea | 5.86% | 6.77% |
| Japan | 5.22% | Outside H1 top five |
| Vietnam | Outside 2025 top five | 7.77% |
| Top five combined | 80.44% | 80.51% |
| HHI, all reported partners | 0.208711 | 0.186920 |
Source: U.S. Census Bureau, USA Trade Online; Cyrionix calculations. 2025 is a full year; H1 2026 covers January–June.
What the data shows
The 2025 origin profile was dominated by Taiwan and China. Together they represented 61.92% of tracked customs value, with the remaining three leading origins—Thailand, South Korea, and Japan—bringing the top-five share to 80.44%. In H1 2026, China moved to first place, Taiwan moved to second, and Vietnam entered the leading five. Thailand and South Korea remained in the group.
The top-five result alone could suggest little change because 80.44% and 80.51% are nearly identical. The Herfindahl-Hirschman Index adds a different view. HHI sums the squared shares of all reported partners, giving more weight to larger origins. It declined from 0.208711 in 2025 to 0.186920 in H1 2026. A stable top-five share and a lower HHI can coexist when value is distributed more evenly inside or beyond the leading group. For bare printed-circuit origin share work, one concentration statistic is not enough.
The rank reversal is period evidence, not a declaration of permanent substitution. The first comparison covers twelve months; the second covers six. Import timing, product mix, pricing, and origin composition can all affect customs-value shares. A later full-year result could differ from the H1 pattern.
How to use origin-share data
The shares are useful for framing where the controlled U.S. border-value exposure was recorded and for deciding which origin-specific policy or logistics questions deserve attention. A buyer comparing China, Taiwan, Thailand, Vietnam, South Korea, or Japan exposure can use the table to prioritize validation of origin, tariff, route, and continuity assumptions, but should then return to supplier- and product-specific evidence.
Diversification cannot be inferred from the country list alone. It requires the buyer’s approved vendor set, common ownership, production sites, tooling location, material sources, qualified alternates, and recovery plans. The customs table supplies ecosystem context; it does not replace that dependency map.
What the data does not show
An origin share is not a supplier share. One origin can contain many suppliers, and a supplier can participate in multiple production and commercial arrangements. These values do not disclose the number of factories, supplier capacity, technology capability, yield, lead time, quality, or buyer dependency.
The basket covers tracked bare printed circuits, not all PCBs and not populated PCBAs. Customs origin is also not the origin of every material or component used to make a board. The data cannot show whether a particular buyer has diversified or whether one country is a better sourcing fit.
Methodology and limitations
Cyrionix summed the same seven validated HTS10 import-for-consumption lines by reported partner and period. Each origin share equals that partner’s value divided by the corresponding World basket value. Rankings were calculated across all reported partners rather than a preselected country list. The top-five share sums the five largest partner values in each period, so the set can change. HHI uses all reported named-partner shares; a small partner-versus-World residual remains unallocated rather than being assigned to a country.
The calculations use nominal USD customs value. They do not weight physical board quantity, area, layer count, technology, specification, or end use. The period labels remain explicit because a full year and a half year are not interchangeable. This note answers the origin-composition question; the separate U.S. import trend note owns the 2021–2025 time series.
Primary source
U.S. Census Bureau, USA Trade Online: Reimagined, official CSV exports for U.S. imports for consumption of the seven validated Basket A1 HTS10 lines by partner, 2025 and January–June 2026. Open the official USA Trade Online report builder.