
Research Data Note
Procurement read: For teams monitoring U.S. bare PCB import data in 2026, the controlled customs basket shows a higher 2025 endpoint than 2021, with a setback in 2023. January–June 2026 then came in below the comparable 2025 period for the same seven tracked HTS printed-circuit lines.
Data notes
Publisher
Cyrionix
Geography
United States / World
Primary dataset
U.S. Census Bureau, USA Trade Online
Classification
Seven validated Basket A1 HTS10 lines under heading 8534
Metric
Imports for consumption, customs value in USD
Calculation
Sum the same seven lines inside each period; compare January–June with January–June
Evidence cutoff
August 18, 2026
Parent research
North American PCB & PCBA Sourcing in 2026
Key data
| Period | Customs value | Period note |
|---|---|---|
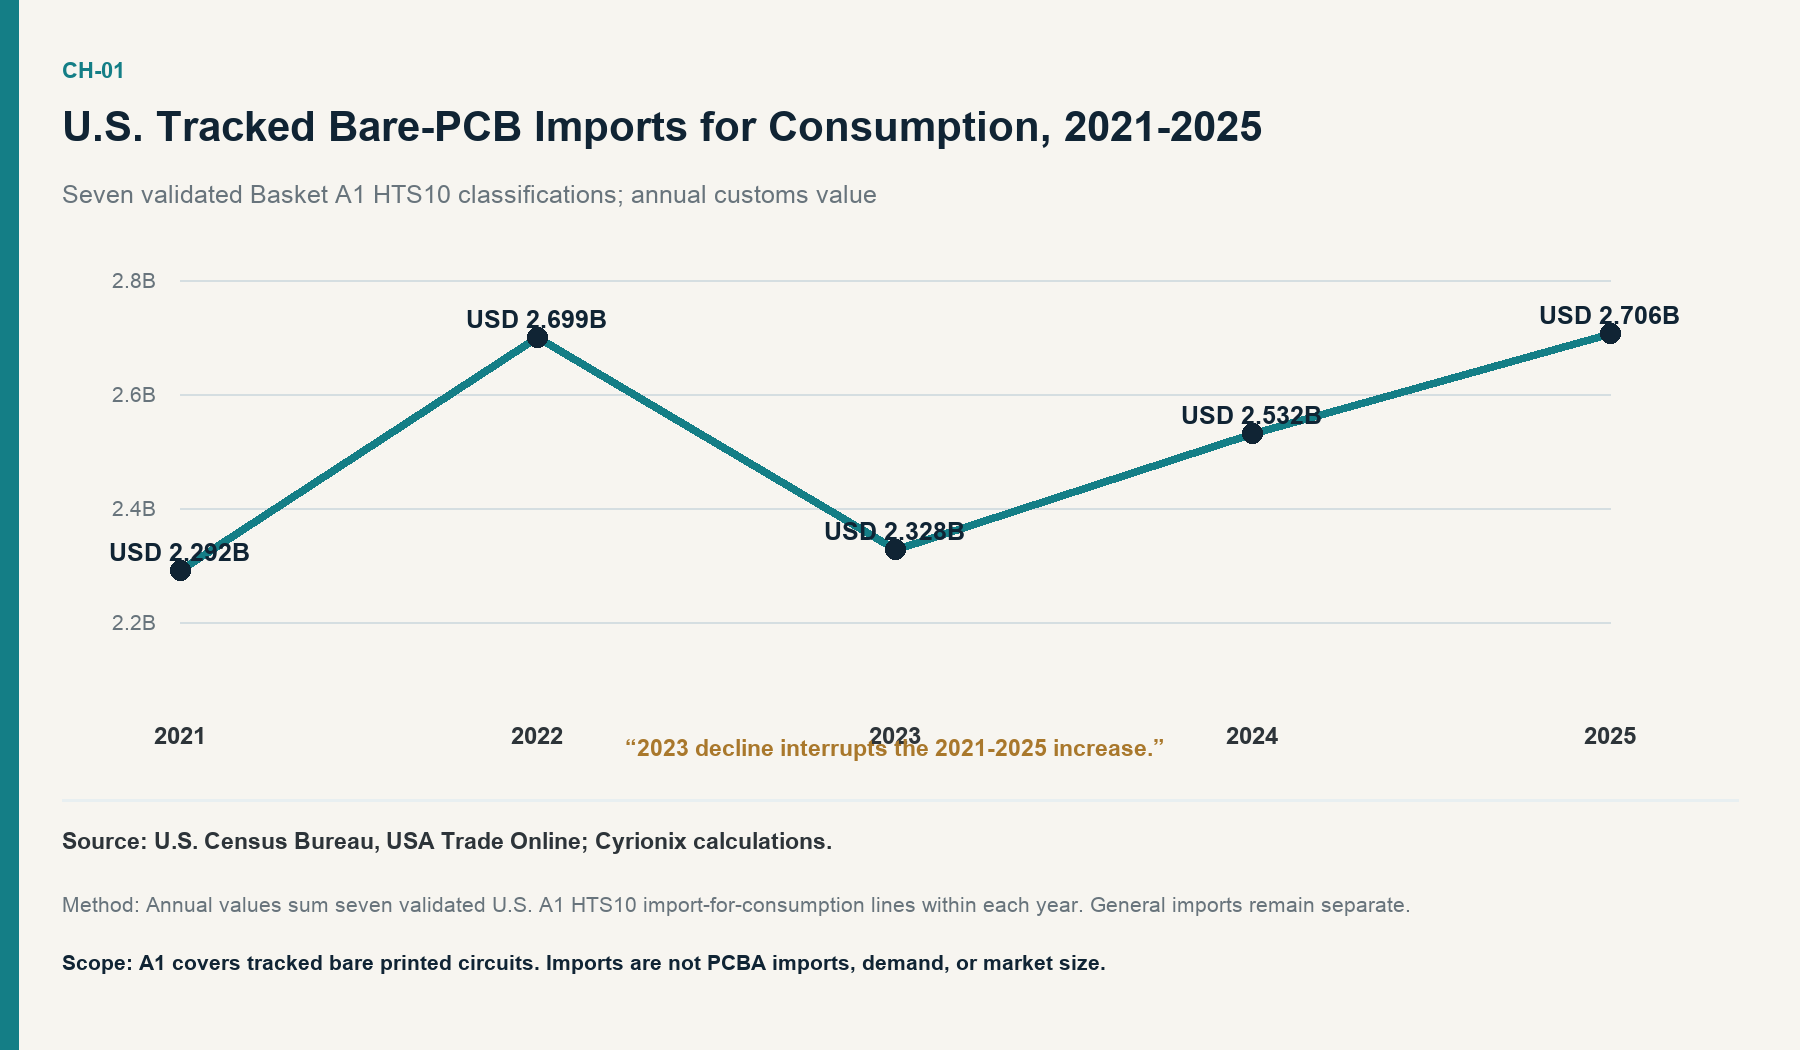
| 2021 | USD 2,291,734,316 | Full year |
| 2022 | USD 2,699,184,587 | Full year |
| 2023 | USD 2,328,390,299 | Full year; decline from 2022 |
| 2024 | USD 2,531,712,897 | Full year |
| 2025 | USD 2,705,856,970 | Full year |
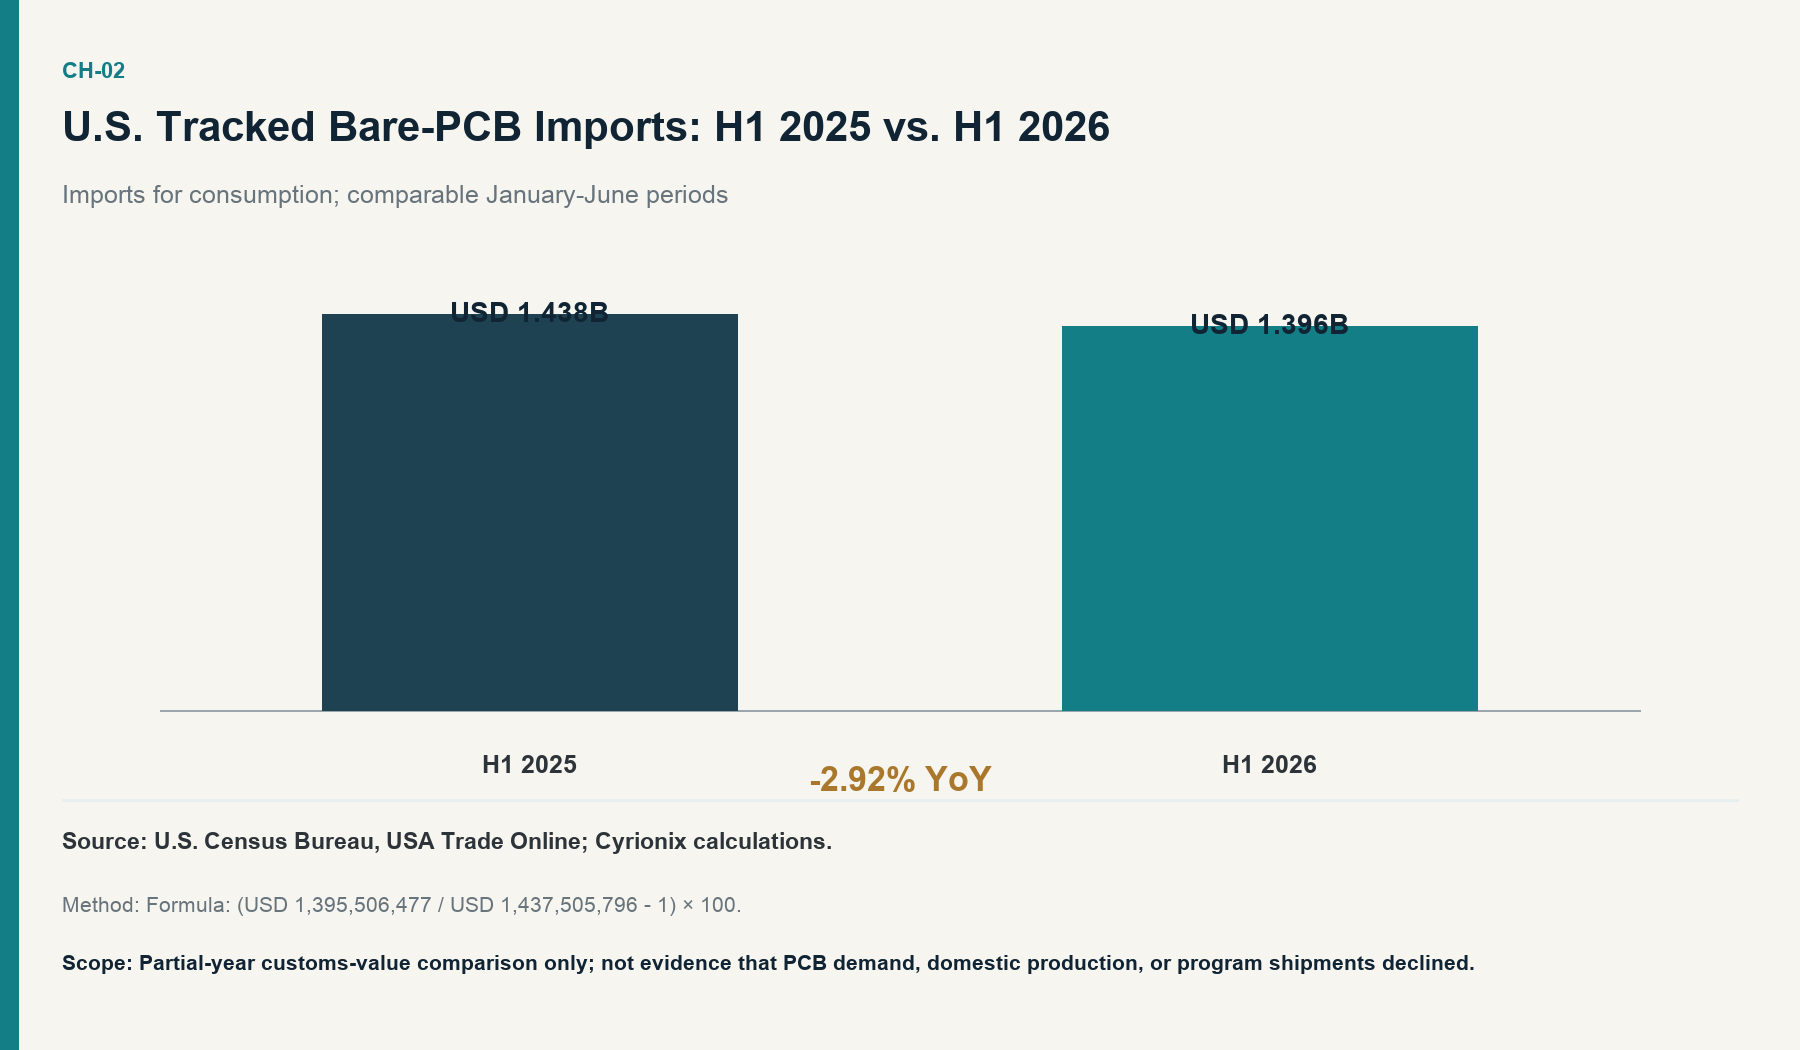
| January–June 2025 | USD 1,437,505,796 | Comparable half-year denominator |
| January–June 2026 | USD 1,395,506,477 | Comparable half-year; −2.92% year over year |
Source: U.S. Census Bureau, USA Trade Online; Cyrionix calculations. The annual values are not added across years.
What the data shows
The 2025 endpoint was USD 414.1 million above 2021 for the controlled customs basket. That comparison describes the scale and direction of recorded import-for-consumption value over the two endpoints. The intervening values matter: the series rose in 2022, fell to USD 2.328 billion in 2023, then recovered in 2024 and 2025. A sourcing or finance team should therefore read the five-year view as a measured recovery, not as uninterrupted growth.
The latest comparable partial-year result moves in the other direction. The January–June value decreased by USD 41,999,319 between 2025 and 2026. Cyrionix calculated the percentage as `(USD 1,395,506,477 / USD 1,437,505,796 − 1) × 100`, which equals −2.921680% and is reported as −2.92%.
This softening does not stand in for every electronics indicator. Separate broad official U.S. and Canadian electronics-manufacturing series strengthened in 2026. Those series cover different classifications, concepts, currencies, and adjustment bases, so they are counter-context rather than a reconciliation. The disagreement is useful: it prevents one border-value measure from being treated as a universal demand gauge.
How to use the trend
The series is best used as a monitoring baseline for a defined border exposure. A procurement team can compare later releases with the same basket, flow, currency, and period to see whether recorded import value is moving. It can also pair the imports-for-consumption PCB trend with the separate origin analysis to ask whether a change is broad or concentrated in particular partners. Neither use requires converting the value into demand.
For a sourcing decision, the trend is a prompt for narrower checks rather than a verdict. Buyers still need current supplier quotations, product specifications, inventory positions, lead-time commitments, and transaction facts. A lower half-year customs value could coexist with stronger domestic production, different product mix, or different inventory timing; the public trade series does not identify which explanation applies.
What the data does not show
The basket covers tracked bare printed circuits. It is not a measure of PCBA imports, because populated assemblies are generally classified by function or host equipment rather than under one universal PCBA code.
Customs value is not U.S. demand, market size, domestic production, physical board volume, supplier capacity, or program shipments. Value can change with product mix, prices, origin mix, timing, and the choice between domestic and cross-border supply. H1 2026 is not a completed annual result.
Methodology and limitations
Cyrionix preserved seven validated U.S. statistical lines inside Basket A1 and summed their published import-for-consumption values within each calendar year or January–June period. The classification basket and trade flow are held constant across the comparison. General imports remain a separate customs concept and are not mixed into this series.
The data note reports nominal USD customs value. It does not aggregate incompatible quantity units or adjust for board area, layer count, technology, inflation, or exchange rates. It also does not identify the companies, plants, orders, or end uses behind the entries. The 2021–2025 table answers a historical value-trend question; the H1 comparison answers a recent period-matched direction question. Neither can be projected into full-year 2026 without additional evidence.
Primary source
U.S. Census Bureau, USA Trade Online: Reimagined, official CSV exports for U.S. imports for consumption of the seven validated Basket A1 HTS10 lines, annual 2021–2025 and January–June 2025/2026. Open the official USA Trade Online report builder.