
Bare-Board Trade, U.S. Assembly Footprint, Supply Conditions & Origin-Sensitive Costs
Executive Summary
North American PCB/PCBA sourcing in 2026 is a mixed, origin-sensitive system. The United States retains a measurable, geographically concentrated printed-circuit-assembly manufacturing footprint, while imports of tracked bare printed circuits remain concentrated in Asian origins. Several electronics and semiconductor indicators strengthened in 2026 even as U.S. tracked bare-PCB imports softened. At the transaction level, origin affects tariff treatment, but tariff, freight, commercial terms, inventory, quality, and schedule inputs prevent landed cost from being reduced to a universal domestic-versus-offshore comparison.
That conclusion depends on keeping unlike evidence separate. Customs data describe products crossing a border. Manufacturing statistics describe establishments, employment, compensation, and output within a defined industry. WSTS reports semiconductor billings by value. Global Electronics Association programs and ECIA surveys describe participating samples or respondents. None of those layers, alone or in combination, measures the total North American PCBA market.
Key Findings
Tracked U.S. bare-PCB imports ended 2025 above their 2021 level, but the path was not continuous. U.S. imports for consumption of the seven tracked Basket A1 bare printed-circuit classifications totaled USD 2.706 billion in 2025, compared with USD 2.292 billion in 2021. The series rose in 2022, declined in 2023, and recovered in 2024 and 2025. This establishes the scale and path of a defined customs basket; it does not measure PCBA imports, domestic demand, or market size.1
The latest comparable U.S. half-year was softer. Imports for consumption of the same tracked bare-PCB classifications were USD 1.396 billion in January-June 2026, 2.92% below the January-June 2025 value of USD 1.438 billion.1 The comparison does not establish that PCB demand or domestic production declined. Customs value, the Global Electronics Association PCB program, and manufacturing-order statistics cover different universes.
Origin exposure remained concentrated. The five leading origins supplied 80.44% of tracked U.S. A1 import-for-consumption value in 2025 and 80.51% in January-June 2026. A second concentration measure, the Herfindahl-Hirschman Index, eased between those periods, which is a reminder that a stable top-five share does not mean that every aspect of concentration was unchanged.1
Taiwan and China were the two largest 2025 origins. Taiwan represented 33.67% and China 28.25% of tracked U.S. A1 import value in 2025. Their order reversed in January-June 2026, when China ranked first and Taiwan second. The partial-year change is evidence about period composition, not proof of permanent supplier substitution, production capacity, or country-level dependency.1
Canada moved differently from the United States. Canadian imports of five tracked A1 bare-PCB classifications were CAD 506.1 million in 2025 and CAD 262.6 million in January-June 2026, 3.20% above the comparable 2025 period.2 Canadian values remain in CAD and follow Canadian national classifications. They are not added to U.S. dollar values or interpreted as a North American market total.
Official structural data document a material U.S. assembly-manufacturing footprint. The 2022 Economic Census reported 891 establishments, 54,438 employees, 35,170 production workers, USD 24.471 billion in shipments, USD 17.476 billion in material costs, and USD 7.895 billion in value added for NAICS 334418, Printed Circuit Assembly (Electronic Assembly) Manufacturing.3 These figures describe the covered industry in 2022. Shipments are output rather than market size; employment is not capacity; and establishments are not necessarily factories.
Tariff treatment was materially origin-sensitive at the evidence cutoff. For tracked A1 codes 8534.00.00.20 and 8534.00.00.80, the Column 1 General base rate was Free, but additional-duty treatment varied by origin, Chapter 99 provision, entry date, and qualification. The cutoff scenarios therefore differ for China, Taiwan, Thailand, South Korea, Japan, Canada, and Mexico.4-7 A supplier address does not establish origin, and a tariff line does not by itself establish eligibility for an exclusion or USMCA treatment. Every combined scenario in this report is a RESEARCH ESTIMATE – NOT CUSTOMS ADVICE.
The operating picture behind these structural findings is firm but uneven. Broad U.S. and Canadian electronics indicators strengthened; WSTS semiconductor billings accelerated sharply; and PCB and EMS statistical-program samples reported stronger June booking growth than shipment growth. Yet U.S. tracked bare-PCB imports softened, EMS year-to-date bookings grew more slowly than shipments, and surveyed memory components remained broadly sourceable despite pressure. The evidence does not support a universal shortage narrative.
For procurement teams, the practical implication is methodological. Compare a fixed specification under aligned origin, tariff, freight, commercial, inventory, quality, and schedule assumptions. Preserve unknowns instead of replacing them with a generic country premium. Require dated supplier evidence for lead time, yield, on-time delivery, and quality. The report’s strongest conclusion is not that one sourcing geography is inherently superior; it is that sourcing decisions become more defensible when trade exposure, domestic manufacturing, cycle indicators, and transaction economics are kept distinct and then evaluated together.
01 – How to Read This Report
PCB and PCBA are not interchangeable
A printed circuit board, or PCB, is the board substrate and conductive pattern before or after fabrication, depending on context. A printed circuit board assembly, or PCBA, is a board with components mounted to perform an electrical function. That distinction is essential in trade data. Under the Harmonized System, heading 8534 identifies printed circuits that meet the governing definition. Once components are mounted, an assembly is generally classified by its function, host equipment, or a narrow national provision – not by one universal PCBA code.8
This report uses two controlled customs baskets. Basket A1 contains tracked bare printed-circuit classifications. The U.S. A1 series includes seven validated HTS10 lines under heading 8534; the Canadian A1 series uses five validated national import lines. Basket A2 contains a narrow group of explicit national printed-circuit-assembly provisions. A2 is function-specific and incomplete. A1 and A2 are never added and relabelled as PCBA imports, demand, or market size.
Four evidence layers
The report uses four layers that answer different questions:
| Evidence layer | Primary question | Admitted measures | Does not establish |
|---|---|---|---|
| Basket A1 trade | What value of tracked bare printed circuits crossed the border, from which origins, in which period? | Customs value, origin share, rank, comparable-period change | PCBA imports, demand, market size, domestic output, supplier capacity |
| Basket A2 trade | What value appears in narrow explicit national PCA provisions? | Function-specific assembly trade indicators | Universal PCBA trade coverage or a value to add to A1 |
| U.S. NAICS 334418 manufacturing | What covered U.S. printed-circuit-assembly footprint or output did the statistical program report? | Employment, establishments, wages, Economic Census structural fields | Demand, market size, available capacity, factories, supplier fit |
| WSTS / industry programs / surveys | What value-cycle, program-sample, or respondent condition was reported? | Billings value, sample growth/rates, respondent direction | Universal availability, units, shortage, census results, supplier performance |
| Tariff / landed-cost framework | What treatment and variables apply to a defined transaction scenario? | Base and additional duty, conditional treatment, required cost inputs | Customs ruling, permanent country rate, universal landed-cost premium |
Note: Classification and source type determine what language is eligible. Do not combine layers into a market-size or capacity estimate.
- Trade evidence measures customs value by product classification, flow, reporter, origin, and period.
- Manufacturing evidence measures the footprint or activity of establishments classified to an industry, including employment, wages, output, and orders.
- Supply-condition evidence includes WSTS billings and labelled industry statistical programs or surveys. It provides cycle and sentiment context, not a census of physical availability.
- Sourcing-economics evidence describes tariff treatment and the inputs required for a transaction-specific landed-cost calculation.
An observation is OBSERVED when it reproduces a published field. It is CALCULATED when the result is arithmetic from validated observations and retains its formula. INDUSTRY_STATISTICAL_PROGRAM and INDUSTRY_SURVEY identify evidence based on program samples or respondents. INFERRED marks Cyrionix’s interpretation rather than a statement made directly by a source. Forecasts, where mentioned at all, remain separated by vintage from observed results.
Time and source controls
The research evidence cutoff is August 18, 2026. A source released by that date may be eligible even when it was downloaded later, but the report does not incorporate later developments. The latest complete annual period anchors structural comparisons; partial-year 2026 values are compared only with the same months of 2025.
Material source inconsistencies are not silently resolved. The June 2026 PCB release contains an exact book-to-bill conflict and inconsistent YTD period language. The exact book-to-bill observation is excluded. Only the separately approved direction statement is used. This treatment illustrates the report’s general rule: precision is valuable only when the source and method support it.
02 – North American Sourcing Map
A defined U.S. bare-board trade series
The U.S. sourcing map begins with imports for consumption of the seven tracked A1 bare printed-circuit HTS10 lines. Annual value rose from USD 2.292 billion in 2021 to USD 2.699 billion in 2022, declined to USD 2.328 billion in 2023, recovered to USD 2.532 billion in 2024, and reached USD 2.706 billion in 2025.1 The sequence matters: the 2025 endpoint is above 2021, but the path is not evidence of uninterrupted expansion.
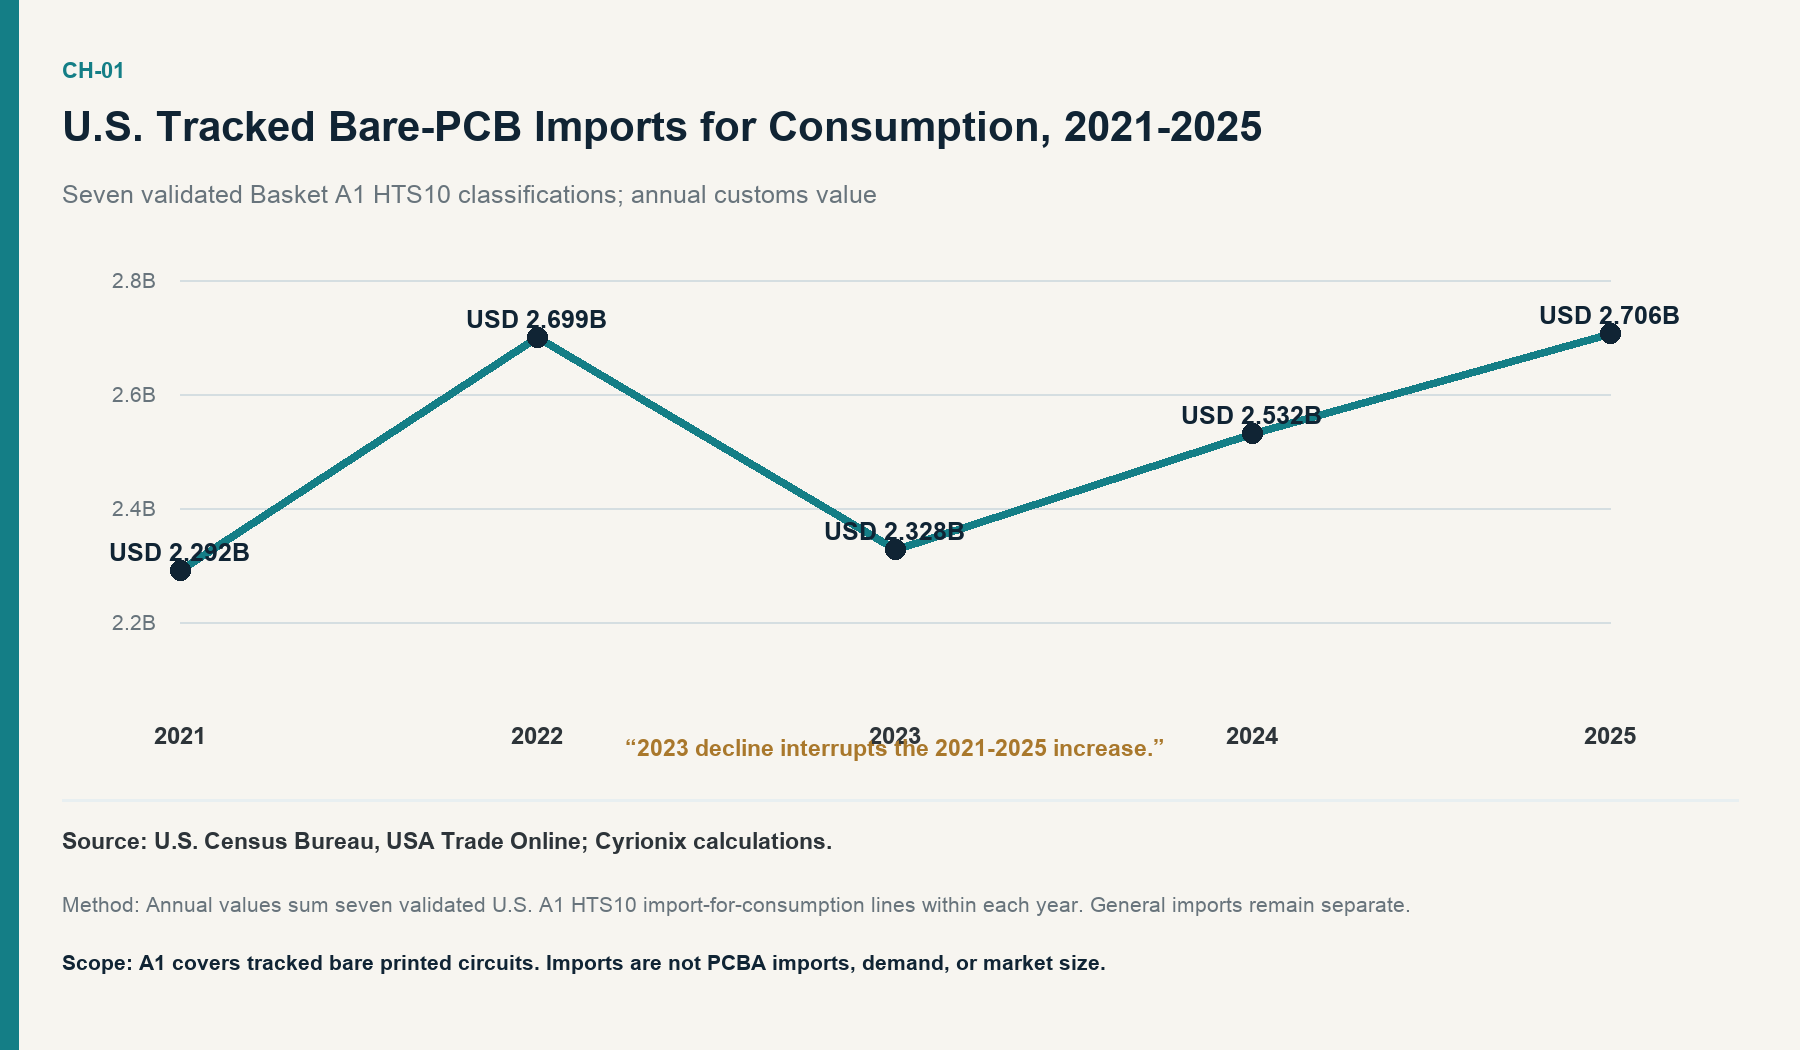
Imports for consumption are used because they are the most relevant customs flow for goods entering U.S. consumption channels. The research also preserved general imports separately, but the two concepts are not mixed. The annual calculation sums the validated HTS10 lines inside each year. Values are not added across years, and no physical quantity is aggregated across dissimilar reporting units.
The series does not include the value of populated assemblies classified under functional parts provisions, boards embedded in finished equipment, or U.S.-made bare boards. It therefore provides a controlled view of border exposure, not an estimate of the value of all boards used in the United States.
H1 2026 softened
In January-June 2025, tracked U.S. A1 imports for consumption totaled USD 1.438 billion. In January-June 2026, they totaled USD 1.396 billion, a 2.92% year-over-year decline.1 That comparison is period-matched and classification-controlled. It is not compared with the full 2025 value.
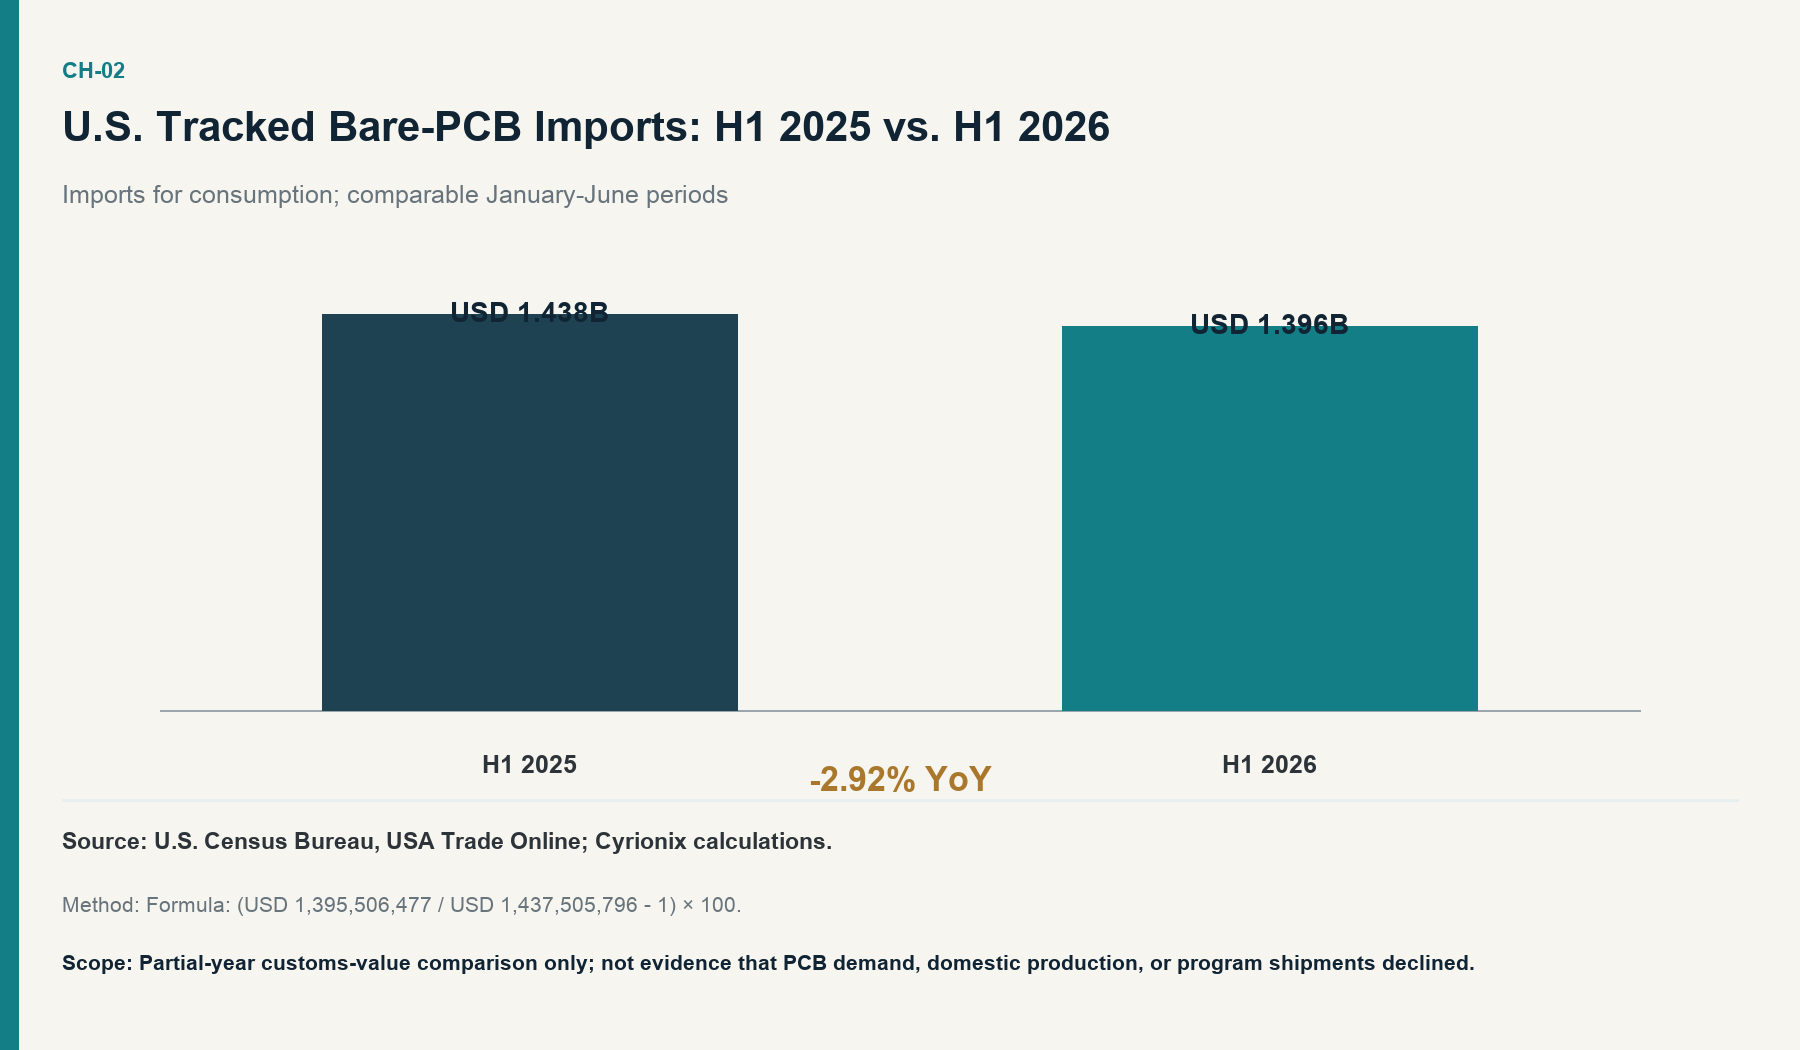
The decline should not be translated into “PCB demand fell.” Customs value can move with quantity, product mix, pricing, sourcing origin, inventory timing, or cross-border versus domestic activity. In the same broad period, official manufacturing-order indicators strengthened, and the June PCB statistical-program sample reported positive shipment and booking growth. Those sources measure different populations. The divergence is analytically useful precisely because it prevents one indicator from standing in for the entire market.
Origin concentration
The five leading origins represented 80.44% of tracked U.S. A1 import-for-consumption value in 2025. The corresponding January-June 2026 share was 80.51%.1 The near-identical top-five shares show that the basket remained concentrated among a small group of origins. They do not show that every origin’s share was stable.
Taiwan was the leading 2025 origin at 33.67%, followed by China at 28.25%, Thailand at 7.43%, South Korea at 5.86%, and Japan at 5.22%. In January-June 2026, China ranked first at 31.14%, Taiwan second at 25.84%, Thailand third at 8.99%, Vietnam fourth at 7.77%, and South Korea fifth at 6.77%.1
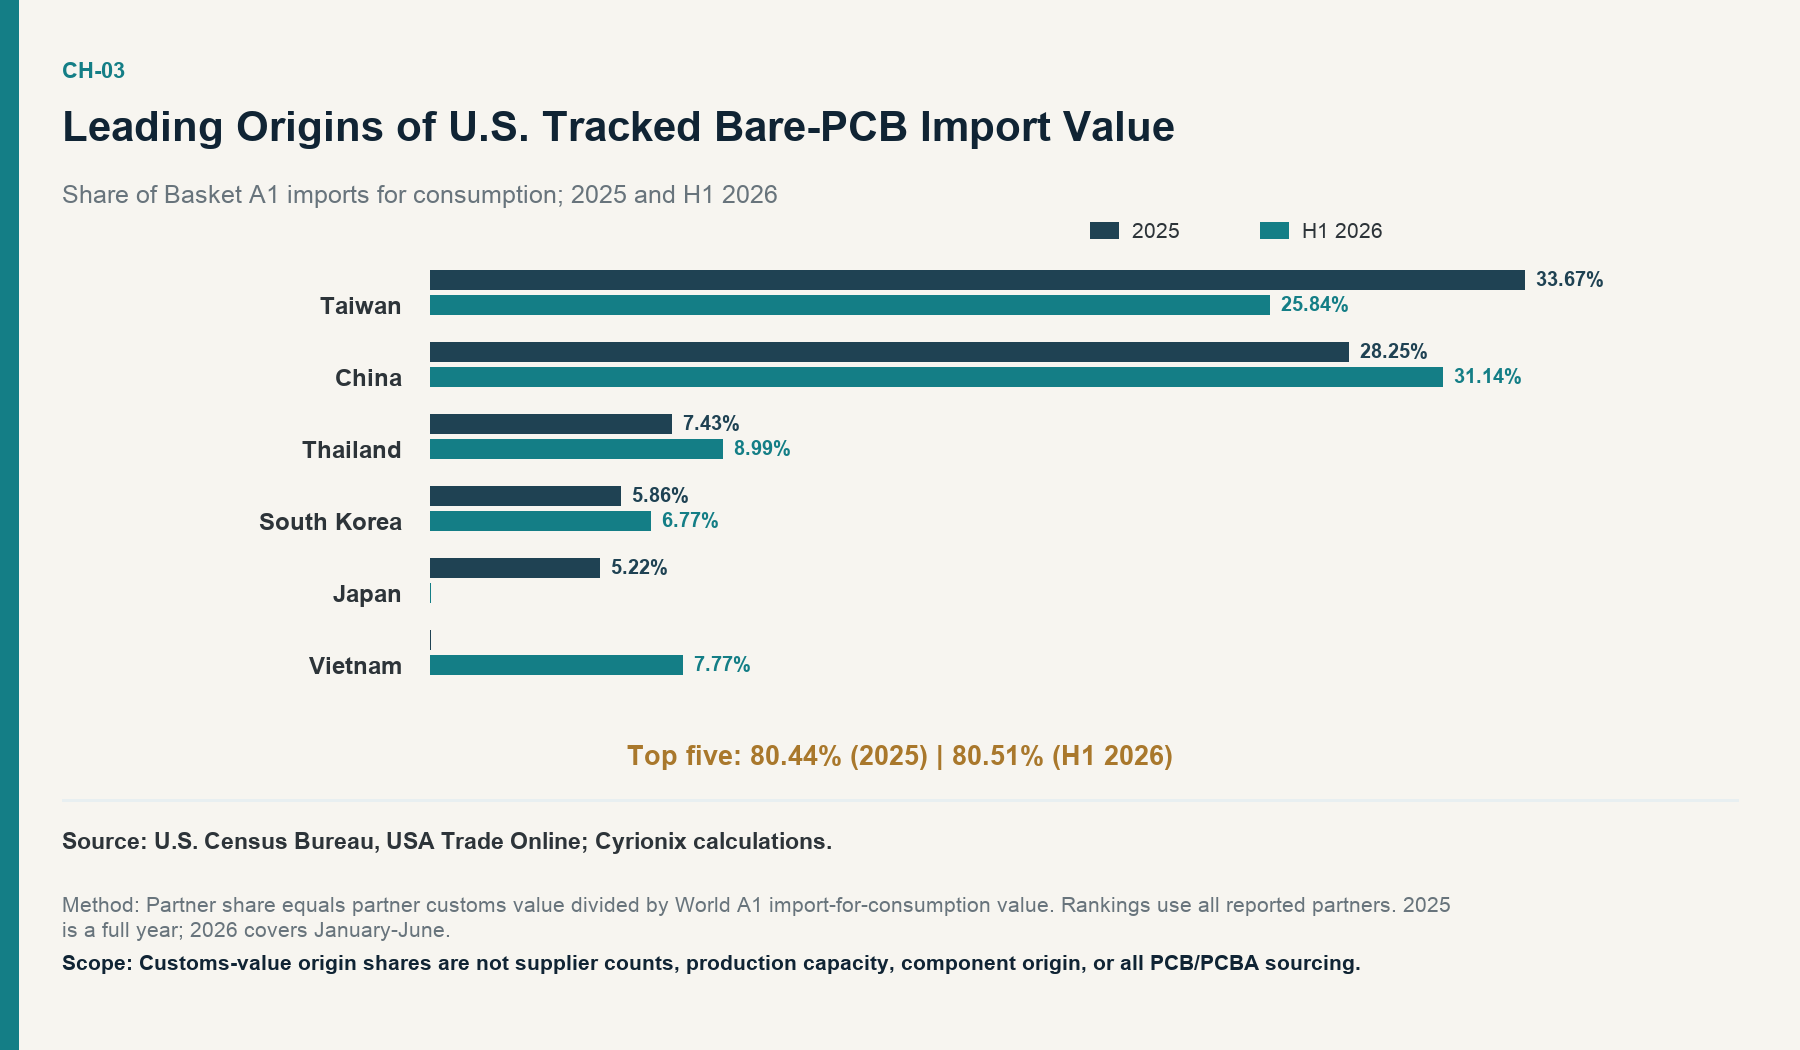
The rank change is not proof of a permanent sourcing shift. The first set covers a full year; the second covers six months. The values also measure origin share of customs value, not supplier count, fabrication capacity, technical capability, or the origin of components later mounted on those boards.
Concentration can affect sourcing decisions in three ways without implying that concentrated sourcing is necessarily insecure. First, origin determines exposure to policy and customs treatment. Second, a small set of origins can make diversification objectives more concrete: buyers can ask whether an alternate supplier changes only the supplier name or also changes the underlying origin. Third, concentration can reveal where qualification effort may be most valuable. None of those observations establishes that a particular country or supplier is unreliable.
The top-five share is also not the only concentration measure. The A1 Herfindahl-Hirschman Index fell from 0.209 in 2025 to 0.187 in January-June 2026.1 The lower HHI reflects changes across the distribution even though the combined top-five share was stable. That counterpoint argues for showing the ranked origin profile rather than relying on one headline statistic.
For sourcing teams, the two measures answer different questions. Top-five share shows how much value sits inside the leading group. HHI gives more weight to the largest individual shares and changes when value is redistributed within or beyond that group. Neither measure counts qualified suppliers, approved fabricators, or unique production sites. A procurement diversification review should therefore connect the customs-origin view to the organization’s own approved-vendor list, tooling ownership, board qualifications, and cross-site continuity. The public data identify concentration at the origin-value level; the buyer’s records determine whether that concentration also exists at the supplier, site, or technology level.
Canadian context
Canadian tracked A1 imports totaled CAD 506.1 million in 2025. They were CAD 254.4 million in January-June 2025 and CAD 262.6 million in January-June 2026, an increase of 3.20%.2
Canada’s increase and the U.S. decline are not combined into one North American rate. The national baskets use different detailed classifications and currencies. The contrast instead demonstrates that the latest direction was not uniform across the two countries. For a sourcing team, that is a reason to identify the purchasing entity, import jurisdiction, and origin path in a quote comparison – not a reason to infer one continental demand trend.
The trade evidence therefore supports a narrow, durable conclusion: the tracked U.S. bare-board import flow is material, concentrated, and origin-sensitive, but its latest direction differs from some other 2026 indicators and from Canada. It does not support a claim about total PCB/PCBA demand, market size, or supply security.
03 – The U.S. PCBA Manufacturing Footprint
Why NAICS 334418 matters
Customs codes classify traded products. NAICS classifies establishments by their primary economic activity. For U.S. PCBA research, NAICS 334418 is unusually valuable because its official definition covers establishments primarily engaged in loading components onto printed circuit boards or manufacturing and shipping loaded boards.8 It excludes bare-board manufacturing and many finished-product activities. That makes it a more precise indicator of U.S. printed-circuit-assembly manufacturing than broad electronics industries, although it still does not identify prototype, low-volume, captive, or supplier-specific activity.
A structural benchmark from the 2022 Economic Census
The 2022 Economic Census reported 891 establishments, 54,438 employees, and 35,170 production workers for U.S. NAICS 334418. It also reported USD 24.471 billion in value of shipments, USD 17.476 billion in cost of materials, and USD 7.895 billion in value added.3
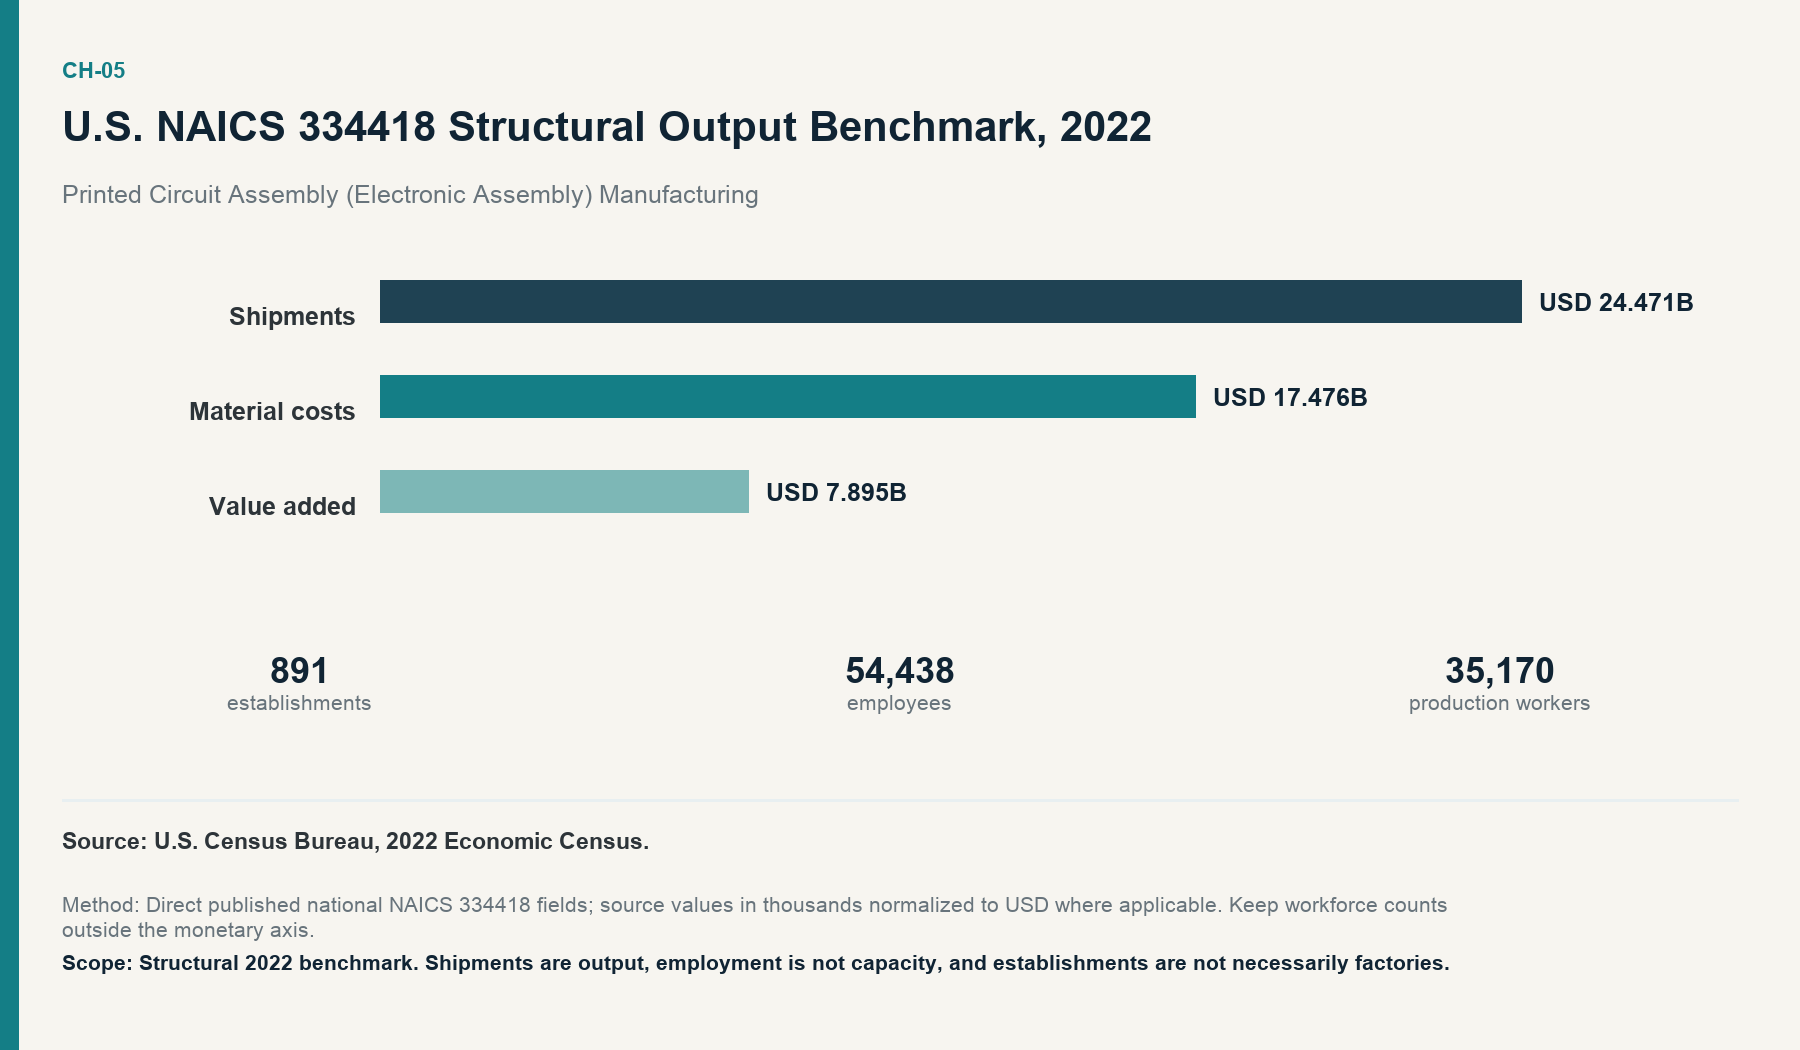
These figures establish a material covered manufacturing base. They do not answer how much U.S. PCBA demand existed, how much assembly capacity was available, or what share of output served prototypes or low-volume programs. Shipments are the value of industry output under the Census concept. They can include products and production relationships that should not be treated as a consumption measure. Material costs and value added describe the structure of that output; adding them to shipments would double-count components of the same production account.
The benchmark is also historical. It describes 2022, not current 2026 output. More recent workforce evidence comes from the Quarterly Census of Employment and Wages, but QCEW and the Economic Census are different statistical programs. The more recent QCEW values cannot be used to update Economic Census shipment, material-cost, or value-added fields.
The preliminary 2025 QCEW footprint
The PRELIMINARY 2025 QCEW annual averages reported 1,242 private-industry establishments and 58,671 employees for NAICS 334418.9 In 2021, the comparable QCEW values were 1,167 establishments and 56,724 employees. The resulting 2021-preliminary-2025 changes were 6.43% for establishments and 3.43% for employment.
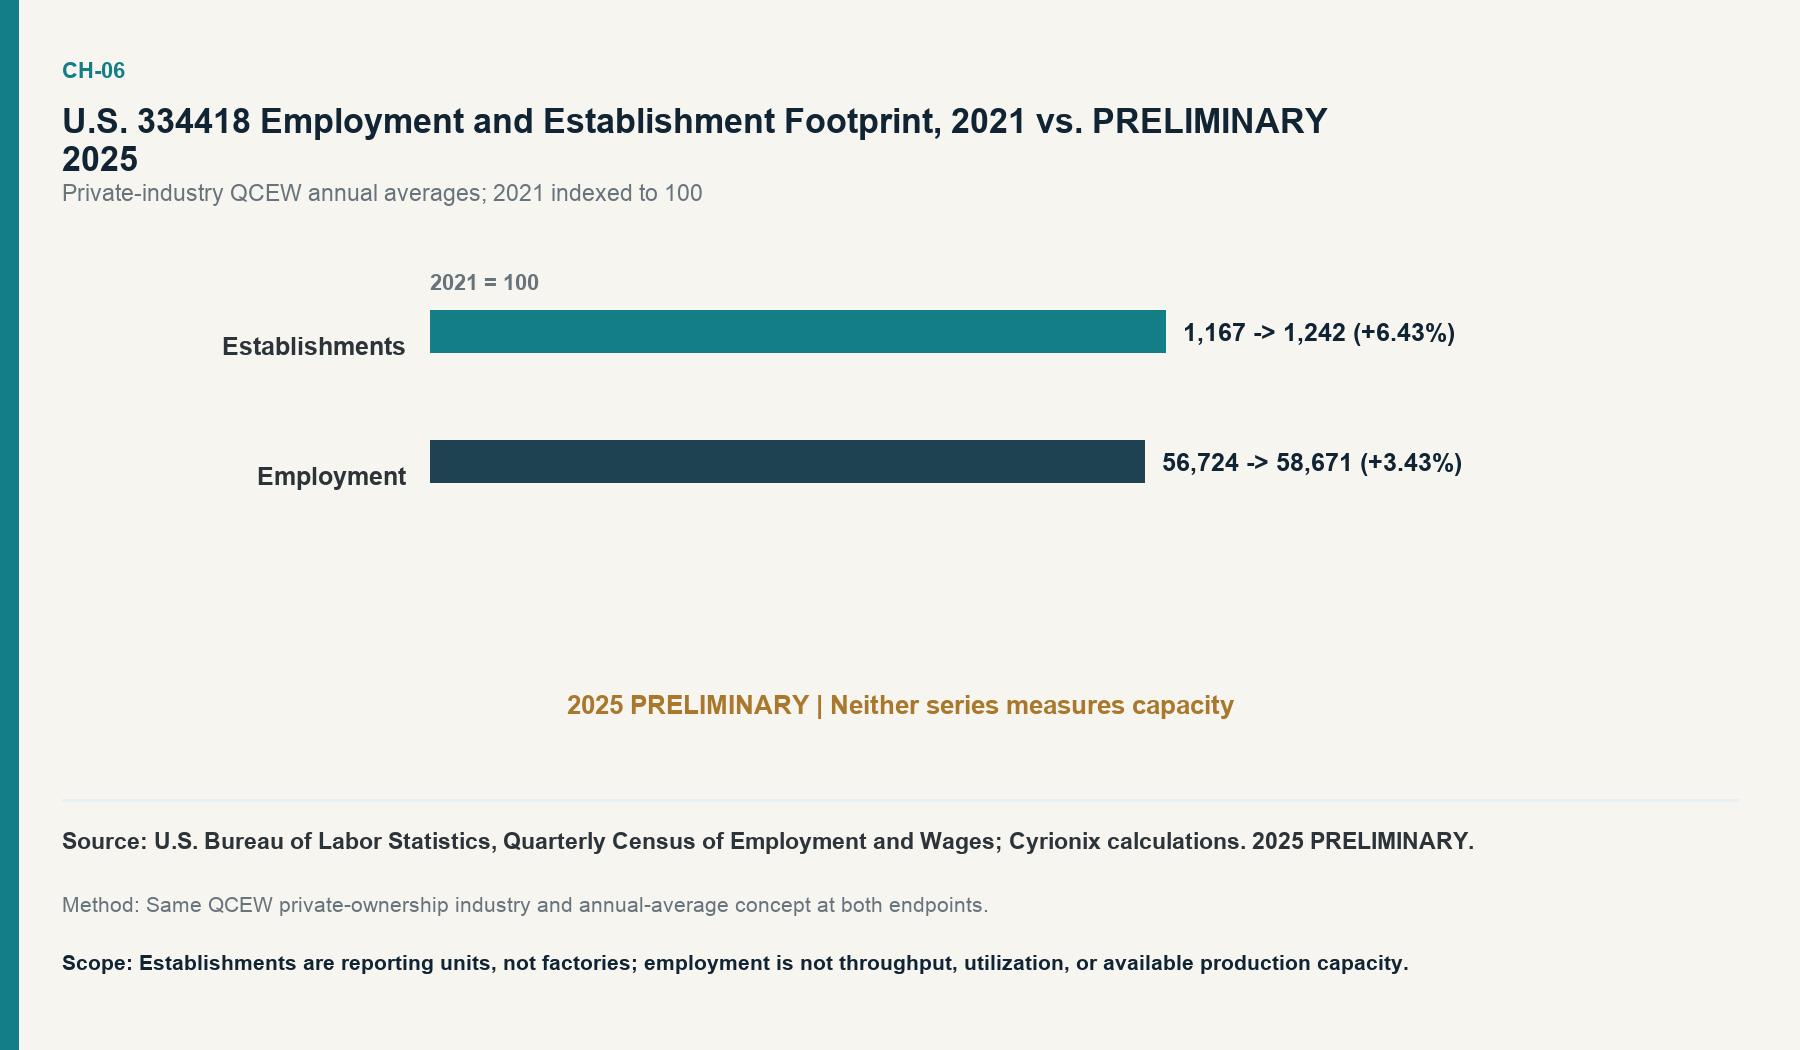
The difference between establishment and employment growth is descriptive. It does not show that facilities became smaller, that utilization changed, or that capacity increased. QCEW establishments are reporting units, not an audited list of physical factories. Employment is a workforce count, not a measure of installed lines, shifts, throughput, technology mix, or available production slots.
The PRELIMINARY 2025 QCEW also reported USD 80,379 in average annual pay for the covered private industry. From 2021 to preliminary 2025, nominal average annual pay rose 19.33%, while total wages rose 23.43%.9 These are nominal compensation measures. They are not adjusted for inflation, benefits, productivity, or output mix and therefore cannot be rewritten as a change in PCBA unit labor cost or total manufacturing cost.
Geographic concentration
In the PRELIMINARY 2025 QCEW, California, Michigan, Texas, Illinois, and Wisconsin accounted for 50.73% of national NAICS 334418 employment reported for private industry. Their reported employment was 8,892; 6,872; 6,756; 4,590; and 2,652, respectively.9
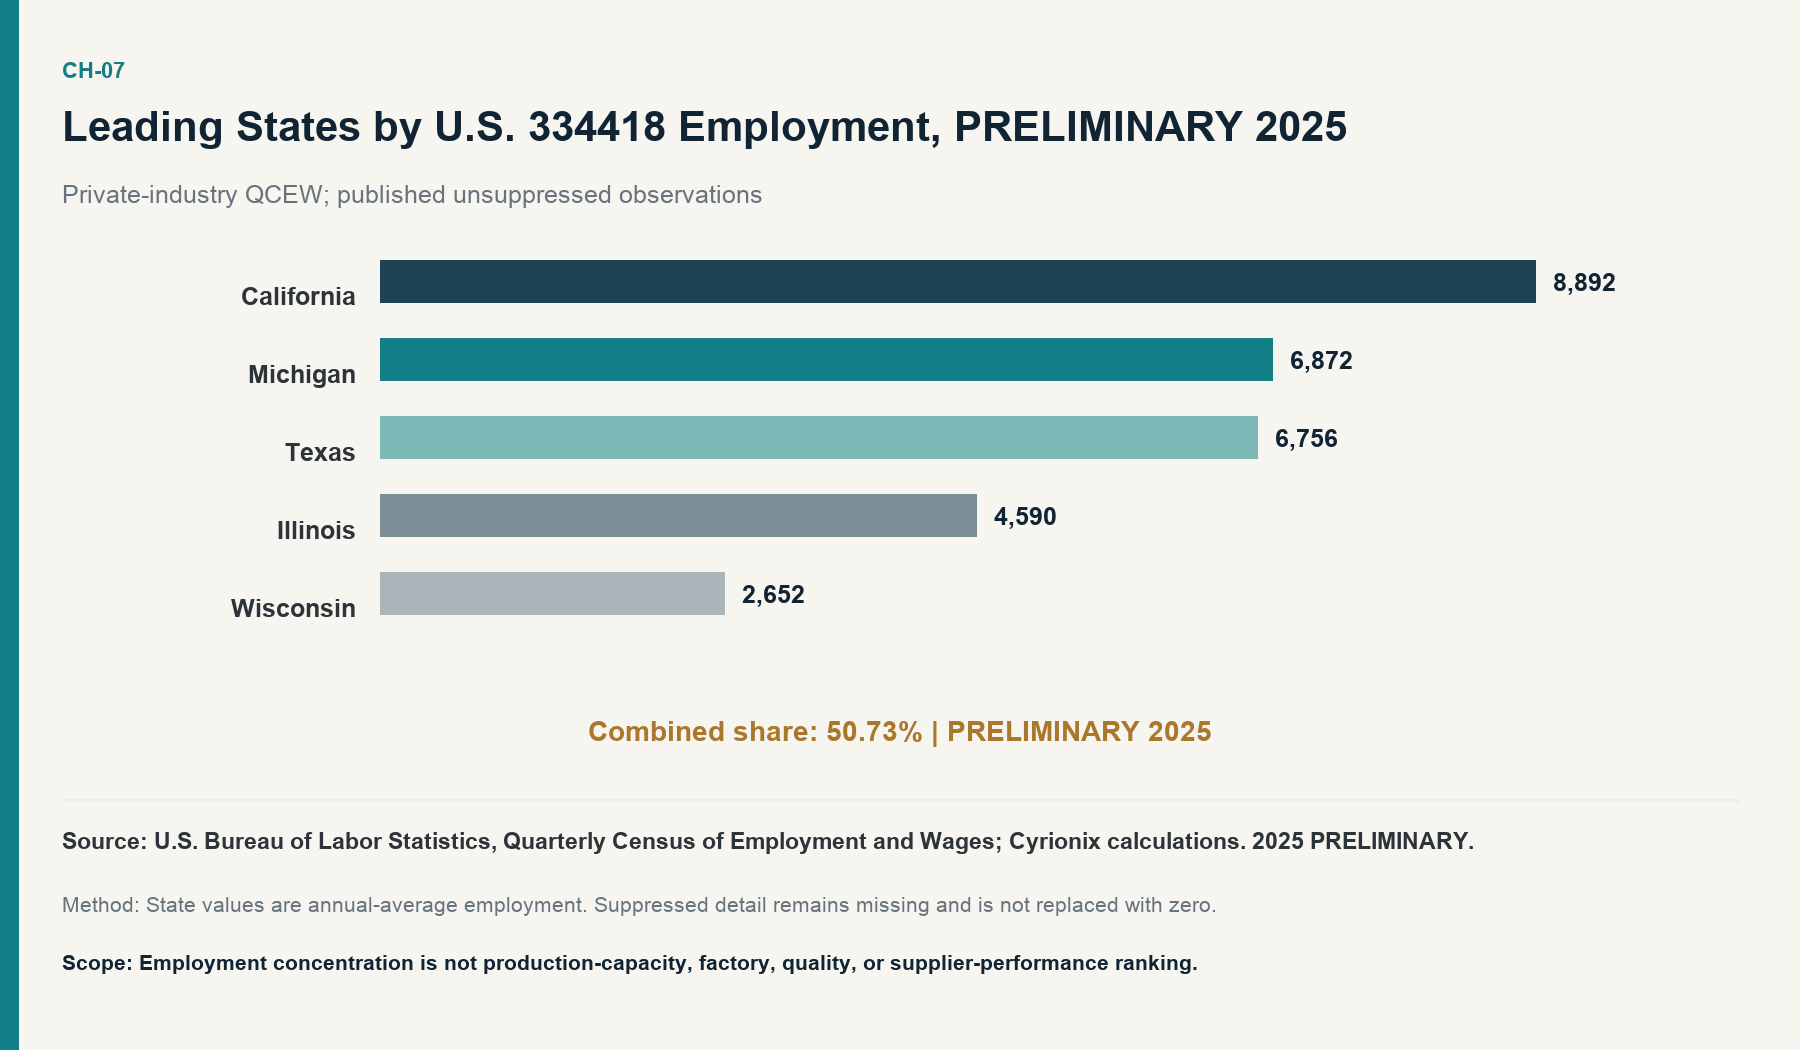
The concentration is relevant to sourcing because workforce location can inform the search for regional assembly ecosystems and the practical geography of supplier visits. It is not a production-capacity ranking. State detail can be suppressed for disclosure protection; suppressed values remain missing and are never replaced with zero. The chart ranks published, unsuppressed employment observations and relates their sum to the national total.
Nor does the state ranking measure supplier fit. A state with a large covered workforce may contain firms serving different technologies, end markets, lot sizes, or ownership models. A supplier qualification still requires product- and facility-specific evidence.
The wage evidence has the same boundary. Higher nominal compensation can affect a manufacturer’s cost context, but a finished assembly price also reflects productivity, automation, materials, test, overhead, lot size, utilization, and commercial policy. The QCEW does not publish those elements as one comparable PCBA cost. Its value for sourcing is more modest: it documents the compensation environment of the covered workforce and prevents labor discussion from relying on an unsupported anecdote.
The geographic data can also guide questions without answering them. If a buyer wants regional redundancy, the state footprint can help identify where covered employment is reported. It cannot establish that two facilities use independent utilities, labor pools, upstream board sources, components, or logistics routes. Geographic diversification and operational independence require separate supplier evidence.
What the footprint does – and does not – establish
The Economic Census and preliminary QCEW agree on one high-level point: the United States has a measurable printed-circuit-assembly manufacturing footprint. They do not establish that the footprint is self-sufficient, that it can replace imported bare-board supply, or that a particular program can obtain capacity on a required schedule. The distinction matters because “domestic manufacturing exists” is a supported structural observation; “domestic capacity is available for this build” is a supplier-level claim that requires an RFQ, process review, and dated production evidence.
04 – A Mixed North American Model
North American sourcing is sometimes framed as a choice between “domestic” and “offshore.” The evidence in this report does not support that binary. Official trade data show material U.S. imports of tracked bare printed circuits, concentrated in several Asian origins. Official manufacturing data independently show a substantial U.S. industry engaged in loading components onto boards and shipping loaded boards. Those activities can coexist in the same supply chain.
A bare board may be fabricated in one origin, imported, assembled in another location, tested under a separate commercial arrangement, and incorporated into a finished product elsewhere. Customs statistics observe selected border crossings. Industry statistics observe establishment activity. Neither dataset traces every board through all stages, and their values overlap when imported inputs contribute to domestic output.
For that reason, the report does not add U.S. A1 imports to Economic Census shipments. It does not subtract imports from shipments, calculate domestic share, estimate import penetration, or infer self-sufficiency. Such calculations would require a reconciled supply-use framework that accounts for exports, re-exports, inventories, imported inputs, captive production, and the classification of populated boards and finished equipment. That framework is not present in the approved evidence.
The mixed model is nevertheless decision-relevant. It tells a buyer to separate at least three questions:
- Where is the bare board fabricated, and what origin evidence supports that conclusion?
- Where and by whom is the board assembled and tested?
- Which entity imports each item, under which classification, transaction value, and effective policy date?
The answers may point to different locations and different suppliers. A U.S. assembly quote does not by itself establish domestic bare-board origin. An Asian bare-board origin does not by itself establish offshore assembly. A supplier’s mailing address does not settle customs origin.
The structure also explains why the trade and manufacturing trends do not have to move together. U.S. tracked bare-PCB imports declined in H1 2026, while broad electronics orders and selected statistical-program indicators strengthened. Product mix, inventories, domestic production, timing, and the different measurement universes can produce divergent signals without making either source invalid.139
“Dependence” also needs a defined object. The trade evidence supports saying that U.S. tracked bare-board import value is concentrated in several origins. It does not show the share of each origin inside a specific OEM’s approved designs, nor whether a buyer has qualified domestic or alternate-origin boards. The manufacturing evidence supports saying that U.S. assembly activity is measurable. It does not show whether that activity uses domestic bare boards or can accept a particular design. The mixed model is therefore structural, not a claim that every North American program follows the same route.
This framing avoids a false policy conclusion. A larger domestic assembly footprint does not automatically reduce bare-board origin exposure, and a diversified origin mix does not automatically create assembly capacity. Buyers can address each exposure, but the controls differ: board qualification and origin documentation for fabrication; process, test, and schedule qualification for assembly; and transaction records for customs and logistics.
The defensible structural conclusion is therefore limited but useful: measurable U.S. assembly manufacturing coexists with concentrated imported bare-board sourcing. That conclusion supports origin-aware sourcing and supplier qualification. It does not support a North American PCB/PCBA market-size estimate.
| Dimension | Tracked A1 trade | U.S. NAICS 334418 manufacturing |
|---|---|---|
| Object classified | Traded bare printed circuit | Establishment’s primary manufacturing activity |
| Primary unit | Customs value by flow, origin, and period | Employment, establishments, compensation, or published output field |
| Geographic meaning | Reporter and origin/partner under customs methodology | U.S. establishment location / national industry total |
| Eligible conclusion | Scale, direction, and origin concentration of the tracked trade basket | Size and structure of the covered assembly-manufacturing footprint |
| Prohibited conclusion | PCBA demand, market size, domestic production | Import penetration, demand, available capacity, self-sufficiency |
| Combination rule | Do not add to domestic shipments | Do not subtract imports or treat imported inputs as independent of output |
Note: A supply-use framework would be required to estimate domestic share or market size. The approved corpus does not contain that framework.
05 – The 2026 Electronics Cycle
Broad official indicators strengthened
Separate official manufacturing series pointed to stronger electronics activity in 2026. U.S. Census M3 electronic-components shipments rose 5.73% in January-June 2026 from the same 2025 months, while new orders rose 8.39%. Statistics Canada’s published 33441 manufacturing-sales series rose 4.59% over the comparable half-year.1011
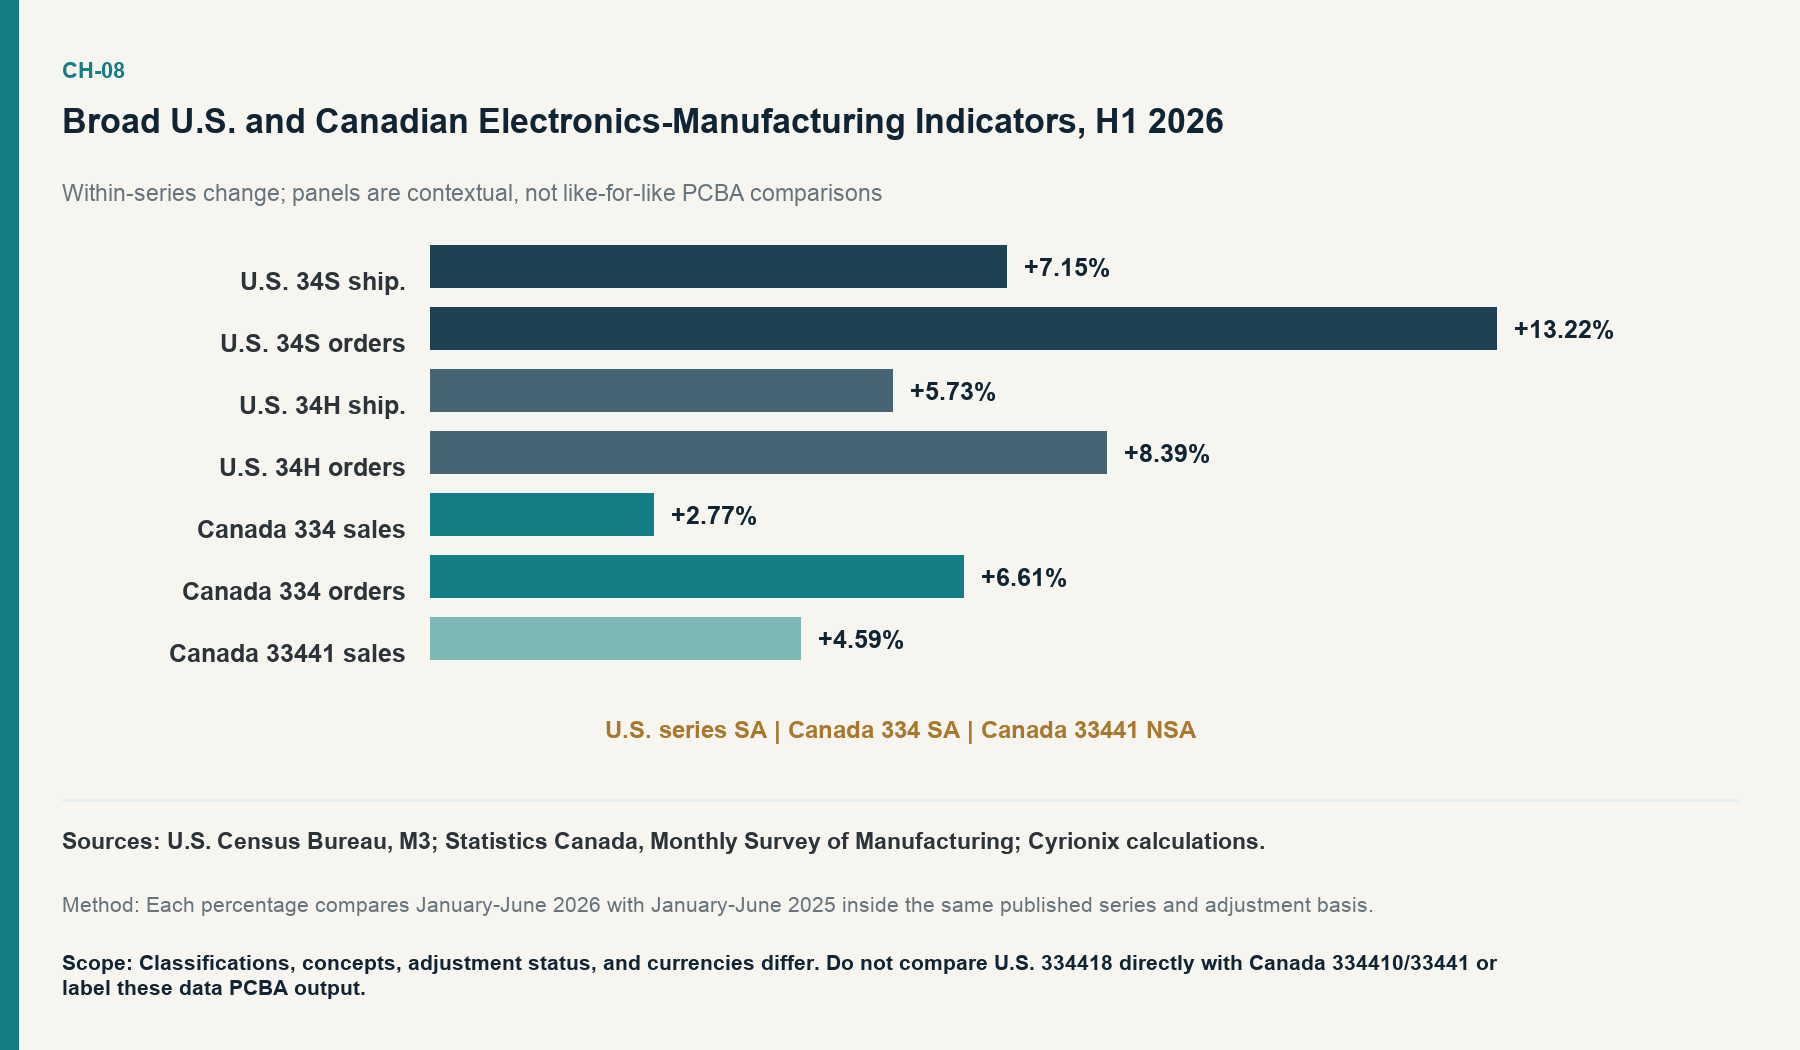
Those are parallel contextual signals, not a like-for-like U.S.-Canada PCBA comparison. U.S. M3 categories and Canadian Monthly Survey of Manufacturing categories differ in classification, concept, seasonal adjustment, and currency. U.S. NAICS 334418 is more specific to assembly than Canada’s published 33441 component aggregate. The report therefore shows within-series changes in separate panels and does not rank national PCBA growth.
The counter-evidence is visible. U.S. tracked A1 bare-PCB imports fell 2.92% over the same half-year comparison, and Canadian inventories were higher in a relevant broad series. A stronger orders or sales measure can coexist with inventory accumulation, price/mix changes, or softer imports. “Electronics strengthened” is therefore a contextual description of several official indicators, not a conclusion that every product and channel expanded.111
Semiconductor billings accelerated sharply
WSTS worldwide semiconductor billings totaled USD 701.887 billion in January-June 2026, 102.29% above the January-June 2025 value. Americas billings rose 122.03% and represented 35.05% of worldwide H1 2026 value.12
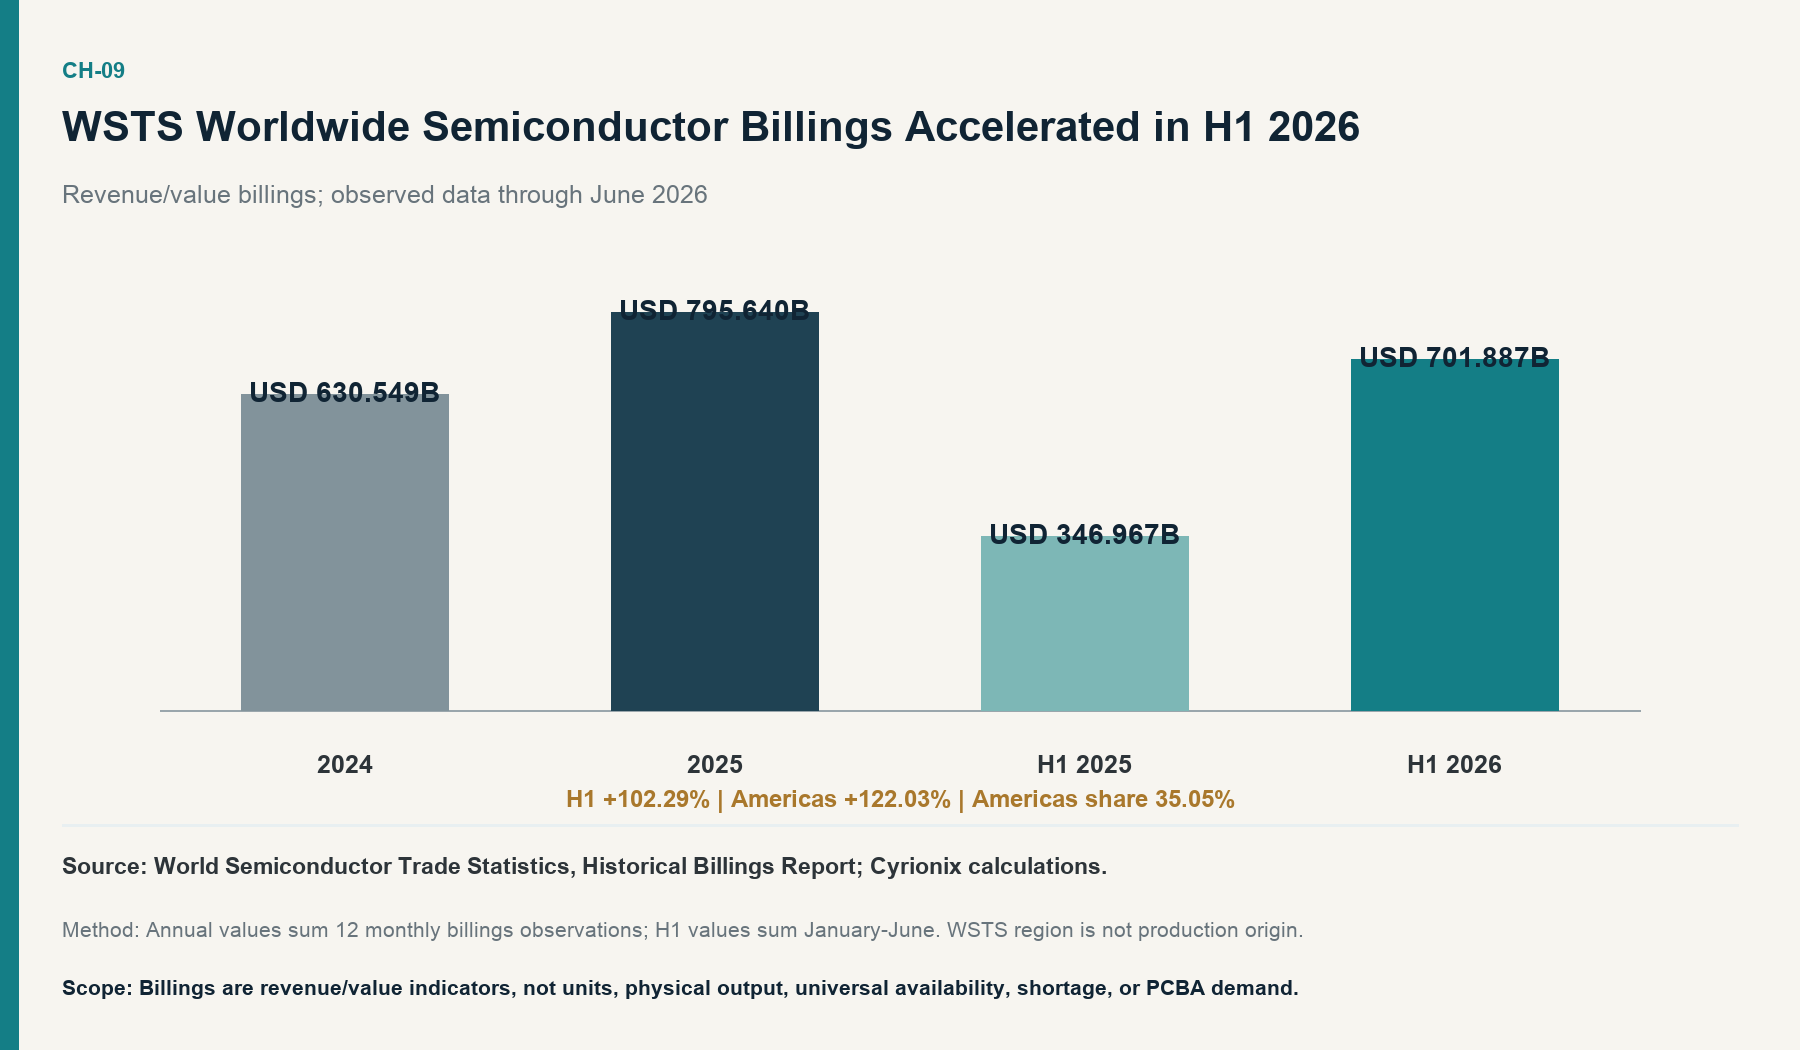
The scale of the change makes it an important cycle signal. Its interpretation must remain bounded. WSTS billings measure revenue/value, not physical units, wafer starts, fabrication origin, component availability, or PCBA demand. Value can change with product mix and pricing as well as units. Regional billings identify the region to which semiconductor products are billed or shipped under the dataset’s concept; they are not a map of production origin.
The billings result also does not prove universal scarcity. In separate survey evidence, memory remained broadly sourceable even while respondents reported pricing and lead-time pressure. Strong value growth and uneven availability can coexist. Procurement teams should treat WSTS as a cycle indicator and then use part-specific quotes, allocations, and lead-time evidence for a BOM decision.
PCB and EMS samples showed a June booking pulse
Within the Global Electronics Association INDUSTRY_STATISTICAL_PROGRAM samples, June 2026 PCB bookings rose 31.5% year over year, compared with 12.0% for shipments. In the separate EMS program, bookings rose 29.3%, compared with 6.7% for shipments.1314 Both samples therefore showed faster June booking growth than shipment growth, but their rates are not combined. PCB fabrication and EMS assembly occupy different positions in the value chain, and the programs do not constitute industry censuses.
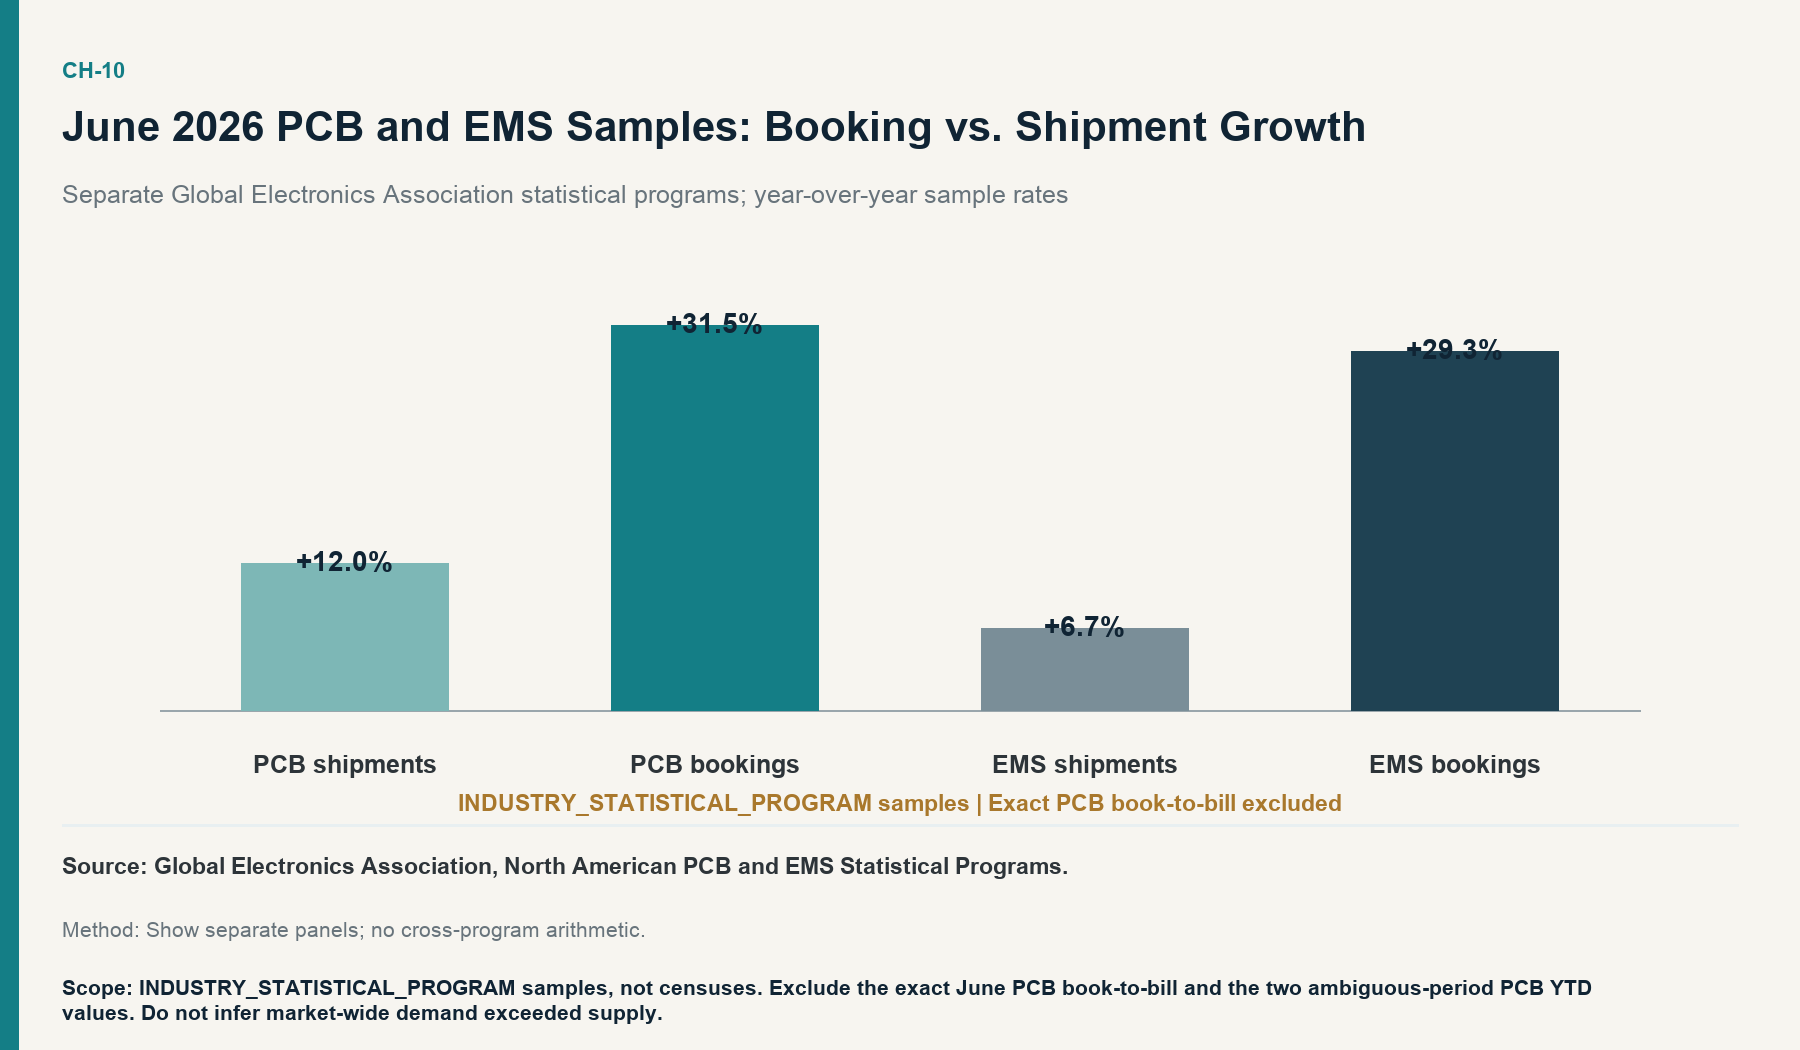
The June comparison is only one horizon. In the EMS program, year-to-date bookings grew 5.0%, while shipments grew 7.4%. Thus, June bookings grew much faster than shipments, but the year-to-date ordering was the reverse. That counterpoint argues against writing that orders were outpacing shipments everywhere or throughout the year.14
The PCB release also uses inconsistent language for its YTD period. The manuscript does not need those two values. The separately labelled June year-over-year shipment and booking rates remain eligible. Keeping the exact book-to-bill and ambiguous YTD period out of the analysis protects the directional conclusion without pretending the source is more precise than it is.
Timing is as important as direction. A single month can reflect order placement around price changes, customer schedules, inventory adjustment, or the comparison base. A year-to-date measure smooths some of that timing but can lag a turn. A three-month ratio offers another horizon but still reflects the program sample. The report therefore compares horizons without choosing one as the universal cycle signal. Procurement teams should use consecutive releases to update context and use supplier commitments to manage a build.
The distinction between bookings and shipments also prevents a causal shortcut. Faster booking growth does not by itself show that supply was constrained, and shipment growth does not reveal whether backlog, mix, or pricing changed. These measures indicate activity within their programs; they do not decompose the operational cause.
A mixed cycle reading
The most defensible cycle reading is neither uniformly strong nor uniformly weak. Broad orders and sales, semiconductor value billings, and June program bookings strengthened. U.S. tracked bare-board imports softened; the two countries’ trade directions differed; EMS year-to-date bookings did not lead shipments; and survey evidence did not show universal component unavailability.
That mixed reading matters operationally. A team that treats strong billings as proof of shortage may overreact. A team that treats softer imports as proof of abundant supply may underprepare. The evidence supports monitoring several layers and validating the parts, supplier, and timing that actually control a build.
06 – Component & Lead-Time Conditions
Public component evidence is thinner than trade or employment data. The strongest admitted public evidence is directional and survey-based. It cannot support a universal table of weeks by component category, and it cannot replace supplier-specific lead-time commitments.
In ECIA’s July 2026 INDUSTRY_SURVEY, 82% of respondents reported increasing lead times overall, 100% reported increasing semiconductor lead times, and no respondents reported decreasing lead times in any major category.15 These are percentages of respondents in the survey sample, not shares of all components, suppliers, or purchases.
The survey indicated renewed pressure after an easier June comparison, but it did not publish a universal number of weeks for microcontrollers, analog devices, memory, passives, or connectors. A procurement team can use the direction as a prompt to revalidate BOM risk. It cannot copy the respondent percentage into a promised delivery date.
Memory provides a useful example of why survey results should be read together. In a March 2026 Global Electronics Association INDUSTRY_SURVEY, 94% of respondents said memory components were sourceable, while 62% reported limited availability or extended lead times and 82% reported rising prices.16 The statements are not contradictory. “Sourceable” can coexist with longer lead time, tighter allocation, a less favorable price, or fewer acceptable sources.
Other eligible survey summaries described elevated material-cost pressure and labor or talent constraints within their respondent populations.16 Those findings are not official output statistics and do not prove that every assembler or buyer faced the same condition. They support a practical distinction between broad operating pressure and a universal shortage.
Sales sentiment, lead-time direction, material pressure, and talent constraints should also remain separate. A respondent can expect sales growth while reporting longer lead times or higher input costs. A manufacturer can face labor constraints while components remain sourceable. A diffusion index or respondent share describes the balance of reported conditions; it does not quantify the dollar impact on a specific quote or the number of days added to a schedule.
For BOM review, the survey evidence is best used as a triage signal. A team can identify parts with one approved source, constrained package or temperature requirements, long requalification cycles, or an expiring quote and then request current supplier evidence. The public survey does not justify assigning the same risk rating to every semiconductor, passive, connector, or memory item.
Labor and talent observations require the same discipline. Survey respondents can report difficulty hiring or retaining talent, but that does not establish national assembly capacity or the staffing condition of a proposed facility. Supplier questions should address the actual production site, process engineering coverage, inspection and test capability, shift plan, and contingency resources for the program.
Material-cost pressure is not a quoted price series. It can inform the questions placed in an RFQ – material validity, approved substitutes, pass-through clauses, and repricing triggers – but it cannot be converted into an automatic percentage adjustment. The broad PPI and import-price evidence discussed later provides context at a different level and still does not replace a specification-matched quote.
Inference: Taken together with semiconductor billings, broad orders, above-parity EMS readings, the direction-only PCB evidence, and the July lead-time survey, the evidence is consistent with a firmer but uneven sourcing environment as of the cutoff. It does not establish a universal component shortage. U.S. bare-PCB imports softened, EMS year-to-date bookings lagged shipments, and surveyed memory remained broadly sourceable.11012-16
For buyers, the distinction changes the response. Survey evidence can justify earlier review, shorter revalidation cycles, and more explicit quote-validity or allocation assumptions. It does not justify stockpiling every category, accepting any substitute, or assuming that one supplier’s quoted lead time reflects the wider market.
07 – Tariffs Have Become Origin-Sensitive
Why a country label is not enough
A tariff calculation begins with the product, not the supplier’s location. The importer must establish the classification, country of origin, entry date, customs value, and eligibility for any special program, exclusion, or exemption. The base HTS rate and each additional-duty program remain separate until the governing provisions make them cumulative.
The report’s tariff scenarios cover tracked A1 codes 8534.00.00.20 and 8534.00.00.80 under the policy state available at the August 18, 2026 evidence cutoff. The preserved schedule is HTS 2026 Revision 16, labelled August 14, 2026 in the official USITC archive.4 Both tracked codes carry a Free Column 1 General base rate. Additional duties, not the base rate, create the principal differences among the approved scenarios.
China-origin tracked A1
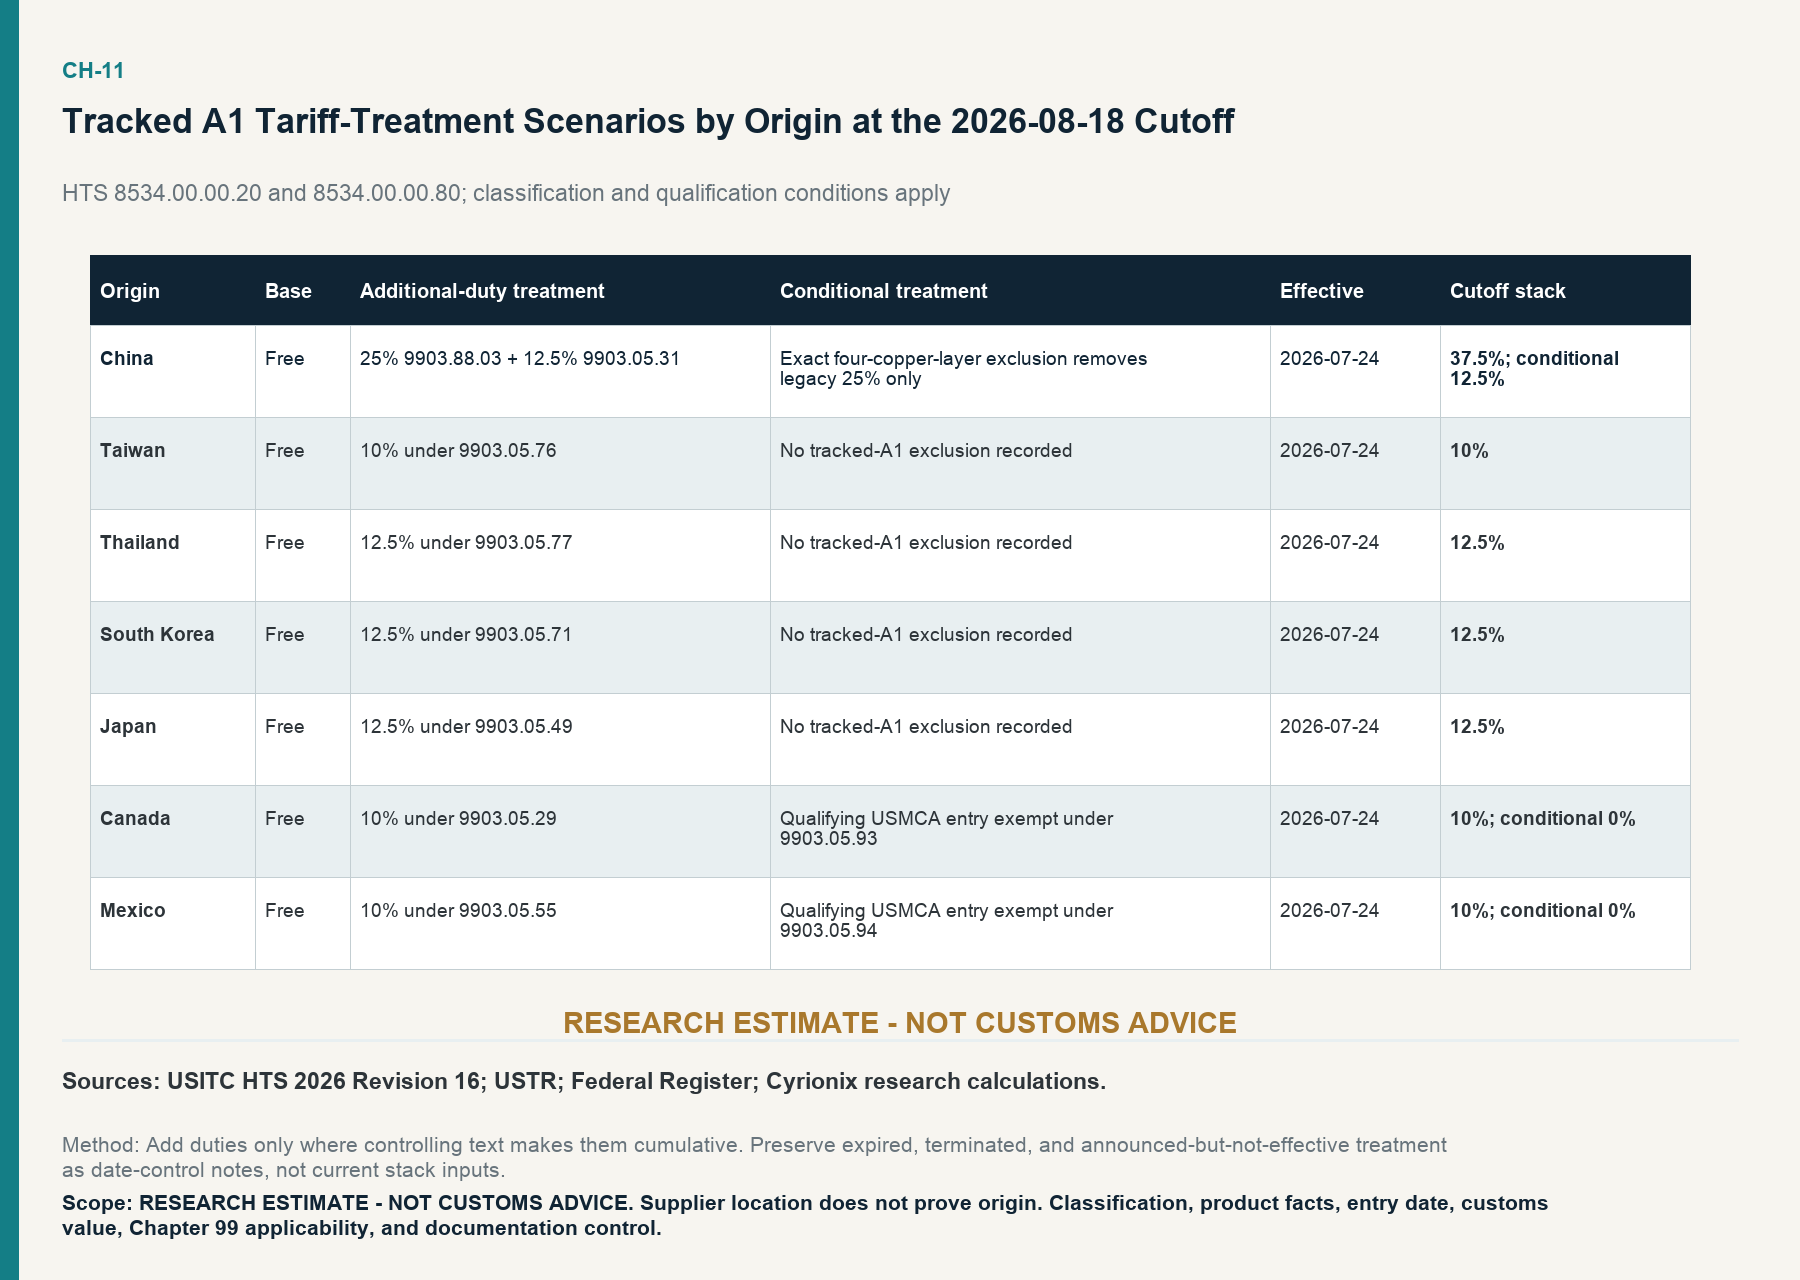
For the tracked A1 classifications under the stated origin and cutoff assumptions, the China scenario combines a Free base rate, a 25% legacy Section 301 duty under Chapter 99 provision 9903.88.03, and a 12.5% 2026 forced-labor Section 301 duty under 9903.05.31. The resulting cutoff research stack is 37.5%.4-6 This is not a universal “China PCB tariff.” It applies only when the product, China origin, entry date, and cumulative-treatment assumptions match the scenario.
A narrow product-description exclusion can change the legacy portion. An item classified in 8534.00.00.20 that exactly meets the current description for a non-flexible, plastics-impregnated-glass printed circuit with four copper layers may be eligible for an exclusion from the legacy 25% duty through November 9, 2026.5 Under the approved cutoff method, that exact subset retains the 12.5% 2026 duty, producing a conditional 12.5% research stack rather than 37.5%. Classification in the tariff line alone does not establish eligibility. Engineering facts and importer documentation must match the exclusion text.
Taiwan, Thailand, South Korea, and Japan
For the same tracked A1 codes and cutoff assumptions, the approved scenarios are:
- Taiwan: Free base plus 10% under 9903.05.76;
- Thailand: Free base plus 12.5% under 9903.05.77;
- South Korea: Free base plus 12.5% under 9903.05.71; and
- Japan: Free base plus 12.5% under 9903.05.49.46
These are code- and origin-scoped research stacks, not universal rates for all PCBAs, electronic assemblies, or products sourced from those countries. Other classifications can have different base rates, exclusions, exemptions, or net-MFN mechanics. The 2026 action became effective for covered entries on July 24, 2026. The research cutoff state therefore cannot be copied backward to an earlier entry date or forward to an unknown future transaction.
The Taiwan record also illustrates the difference between a policy announcement and incurred treatment. The eligible May notice stated that the signed Agreement on Reciprocal Trade had not entered into force for the tracked products. The approved matrix therefore does not substitute an announced-but-not-implemented rate for the treatment in force at the cutoff.7
Canada and Mexico
For a Canada-origin tracked A1 entry, the approved scenario is Free base plus 10% under 9903.05.29. A qualifying USMCA duty-free entry can be exempt under 9903.05.93, producing a conditional 0% research stack. For Mexico, the corresponding additional-duty and exemption provisions are 9903.05.55 and 9903.05.94.46
The word “qualifying” carries the analytical burden. A Canadian or Mexican supplier address does not prove that the good satisfies the applicable origin rule or that the importer has the records required to claim treatment. A non-qualifying entry remains in the 10% scenario. A U.S. domestic purchase does not create an import-duty calculation, although it can carry other logistics, tax, and commercial costs.46
| Origin scenario | Column 1 General base | Additional-duty treatment | Conditional exclusion or exemption | Cutoff research stack |
|---|---|---|---|---|
| China | Free | 25% legacy Section 301 under 9903.88.03 + 12.5% 2026 action under 9903.05.31 | Exact four-copper-layer 8534.00.00.20 product-description exclusion through 2026-11-09 removes only the legacy 25% when every specification is met | 37.5%; conditional 12.5% for exact qualifying subset |
| Taiwan | Free | 10% under 9903.05.76 | No tracked-A1 exclusion recorded in the cutoff matrix | 10% |
| Thailand | Free | 12.5% under 9903.05.77 | No tracked-A1 exclusion recorded in the cutoff matrix | 12.5% |
| South Korea | Free | 12.5% under 9903.05.71 | No tracked-A1 exclusion recorded in the cutoff matrix | 12.5% |
| Japan | Free | 12.5% under 9903.05.49 | No tracked-A1 exclusion recorded in the cutoff matrix | 12.5% |
| Canada | Free | 10% under 9903.05.29 | Qualifying USMCA duty-free entry exempt under 9903.05.93 | 10%; conditional 0% |
| Mexico | Free | 10% under 9903.05.55 | Qualifying USMCA duty-free entry exempt under 9903.05.94 | 10%; conditional 0% |
Note: RESEARCH ESTIMATE – NOT CUSTOMS ADVICE. The 2026 action was effective for covered entries beginning July 24, 2026. Classification, origin, entry date, customs value, cumulative treatment, exact product facts, and qualification records control. Supplier location does not prove origin. The China exclusion is specification-dependent; a code match alone is insufficient. Expired, terminated, and announced-but-not-effective treatments are not included in the cutoff stacks.
Sources: USITC HTS 2026 Revision 16; USTR China Section 301 materials and exclusion record; USTR forced-labor Section 301 final action; Federal Register and executive materials identified in endnotes 4-7.
Why version control matters
Three policy states in 2026 must not be merged. A temporary 10% import surcharge ended at 12:01 a.m. EDT on July 24 and contributes zero to the August 18 cutoff stack. A separate executive order terminated specified IEEPA duties while leaving other programs unaffected. The forced-labor Section 301 action became effective for covered entries on July 24.67 These records are counter-evidence to any timeless country-rate table.
Before an importer uses a scenario, it should confirm the product description and classification; origin analysis; entry or withdrawal date; customs value; Chapter 99 coverage; cumulative-treatment rules; product-specific exclusions; USMCA or other special-program documents; and any duty program outside this report’s tracked review. Confirmation belongs with the importer and its customs adviser or broker. The matrix is a research framework, not a classification ruling or legal opinion.
The scenario should travel with the quote. A procurement comparison that preserves only the percentage but drops the code, origin, date, or qualification is no longer the same analysis. If a quote remains open across a policy change or a shipment enters after the assumed date, the tariff line should be revalidated before the sourcing decision is refreshed.
The decision value of the tariff analysis is not that it produces one permanent rate. It is that it identifies where a small change in product facts, origin, timing, or documentation can change the duty component of landed cost.
08 – Why Landed Cost Is Not Unit Price
A transaction equation
A supplier quote is one input to a sourcing comparison. For a defined product, shipment, and entry date, the approved framework is:
No term receives a default percentage. A blank means “not yet evidenced,” not zero. The calculation becomes comparable only when suppliers are quoting the same specification, quantity, test scope, delivery point, Incoterm, currency basis, and validity period.
A practical comparison follows a fixed sequence. First, freeze the engineering definition: board construction, layer count, materials, finishes, panelization, test, assembly content, component sourcing responsibility, and acceptance criteria. Second, align the commercial definition: quantity, lot schedule, non-recurring charges, tooling ownership, payment terms, Incoterm, quote currency, and validity. Third, establish the customs definition: importer of record, classification, origin, entry date, customs value, and supporting documents. Only then should the team add route- and service-matched logistics, inventory timing, and measured execution exposure.
This sequence prevents a low unit quote from being compared with a quote that includes different test, material, logistics, or import responsibilities. It also makes disagreement diagnosable. If two scenarios differ, the worksheet should show whether the driver is product scope, commercial allocation, tariff treatment, transport, or an evidenced risk assumption – not bury the difference in a single adjusted price.
Inference: Supplier unit price alone is insufficient when origin, tariff treatment, freight, commercial terms, inventory, and measurable execution risks vary by product, date, and transaction.4-79
Public context versus transaction inputs
Some inputs can be anchored in public evidence. HTS and Chapter 99 sources establish a dated legal framework. Official exchange-rate series can document currency exposure. Wage and price indexes can provide broad context. Those sources do not provide a supplier invoice, freight quote, customs value, yield record, or delivery commitment.
| Variable | Required transaction input | Preferred evidence owner | Public context available? | If missing |
|---|---|---|---|---|
| Product / HTS classification | Approved description, function, construction, mounted-component status, code | Engineering + importer/broker | HTS and classification records | Keep unresolved; do not infer from supplier description alone |
| Country of origin | Origin analysis and substantiating records | Importer / customs adviser | Tariff scenario context only | Do not substitute supplier location |
| Entry date | Expected entry or withdrawal date | Logistics / importer | Dated policy instruments | Revalidate before entry |
| Customs value | Approved customs-value basis and currency | Importer / broker | None that replaces transaction records | Keep blank |
| Supplier price | Specification-, quantity-, test-, and term-matched quote | Supplier / buyer | Broad price indexes only | Keep blank |
| International freight | Route, mode, service, weight/volume, surcharge, and Incoterm-matched quote | Carrier / forwarder / supplier | No universal PCB freight series admitted | USER-SUPPLIED / QUOTE-SPECIFIC |
| Insurance | Policy or shipment-term cost | Buyer / supplier / insurer | No universal default | Keep blank if not applicable or not evidenced |
| Base duty | Rate for approved code and origin | Importer / broker | USITC HTS | Validate for entry |
| Additional duties | Each applicable program and Chapter 99 provision | Importer / broker | Official legal instruments | Test separately; add only if cumulative |
| Exclusion / exemption | Exact legal text plus product and qualification records | Engineering + importer | Official exclusion/program sources | Do not assume eligibility |
| Broker/customs costs | Broker schedule or transaction invoice | Broker / importer | No universal default | Keep blank |
| Domestic logistics | Route- and service-matched quote | Carrier / supplier / buyer | No universal default | Keep blank |
| Inventory exposure | Value, days, and buyer-approved carrying-cost method | Finance / operations | Public rates do not set buyer policy | Keep explicit and unpriced if method absent |
| Quality/rework exposure | Product/supplier defect, yield, rework, and disposition records | Quality / supplier | Industry surveys do not substitute | Do not apply a country factor |
| Schedule exposure | Explicit probability, consequence, and time horizon | Program / operations | Sector indicators provide context only | Do not assign an arbitrary premium |
Note: Landed cost is transaction-specific. A blank means “not yet evidenced,” not zero. No universal U.S.-versus-China cost gap is calculated.
For example, the broad BLS NAICS 3344 producer-price index averaged 19.33% higher in January-June 2026 than a year earlier and was 27.69% higher in June 2026 than in June 2025.17 The series is a domestic producer net-output index for a broad electronic-component industry. It is not a PCBA quotation, unit cost, import price, margin, or availability measure. A different Canadian broad index had a different H1 direction and is not directly comparable.
The narrower U.S. 334418 and related product PPIs showed anomalously large movements in 2026. Their sample and product mix, index basis, and revision exposure do not support translating them into a universal PCBA cost or quote change. The exact changes are omitted from the main narrative because they do not improve the transaction comparison.
Official exchange rates are also exposure indicators rather than pass-through estimates. Contract currency, hedging, imported input content, bargaining, and supplier pricing decisions determine whether an exchange-rate change reaches a quote.18 U.S. wage measures describe domestic labor context, not a foreign cost comparison or standardized unit labor rate.
The largest public-data gap is freight. No publicly reproducible universal PCB freight-cost series was admitted. Freight therefore remains USER-SUPPLIED / QUOTE-SPECIFIC. Route, origin and destination, transport mode, service level, dimensional weight, shipment size, fuel and accessorial charges, and Incoterm must be fixed before the number is meaningful. A one-off quote can support a transaction scenario; it cannot become an industry-wide country premium.
Execution exposure must be evidenced
Quality, rework, and schedule exposure can matter, especially when build quantity is low and setup, test, or expedite costs are material to a lot. The framework does not assign a country percentage to those risks. It requires measured product and supplier evidence: defect and yield records, rework cost, on-time delivery, schedule variance, audit results, and an explicit probability/consequence model where a monetary risk value is used.
The result is deliberately less tidy than a single “offshore premium.” It is also more useful. It shows which inputs are known, which are conditional, who owns each missing value, and which assumption can change the sourcing decision.
09 – Implications for Prototype & Low-Volume Buyers
The following are evidence-supported procurement considerations, not universal rules. They translate the report’s observed and inferred findings into questions a buyer can test on a specific program.
1. Review BOM risk before the build becomes urgent
The 2026 evidence is consistent with a firmer but uneven sourcing environment. Strong semiconductor value billings and survey-reported lead-time pressure justify reviewing constrained or single-source items earlier. They do not justify treating every component as scarce. Segment the BOM by approved source count, lifecycle status, allocation terms, quoted lead time, price validity, and substitution difficulty.1121516
2. Separate fabrication, component, and assembly schedules
A single “lead time” can hide different clocks: design release, DFM response, bare-board fabrication, component commit, inbound logistics, assembly slot, test, rework, and outbound delivery. Ask the supplier to identify each stage and the assumptions behind it. An industry survey or book-to-bill direction can provide context; it cannot replace a dated schedule for the actual job.
3. Validate alternates before urgency arises
An alternate part is not validated merely because it fits a distributor search result. Engineering should confirm electrical, mechanical, firmware, regulatory, lifecycle, and test implications before the primary part becomes unavailable. The evidence does not support a forecast that any named component will become scarce; it supports maintaining decision-ready alternatives where BOM concentration is consequential.
4. Make origin part of quote comparison
Ask where the bare board is fabricated, where components are loaded, and what origin analysis supports the imported item. Supplier location, invoicing entity, fabrication site, assembly site, and customs origin can differ. Record the answer at the product and shipment level rather than applying one country label to the whole supply chain.
5. Verify tariff assumptions at transaction level
Record the proposed HTS code, country of origin, entry date, customs value basis, Chapter 99 provisions, and any exclusion or USMCA qualification documents. Revalidate treatment before entry. A quote that says “tariff included” without its classification and policy assumptions is not comparable with a quote that excludes duty or assumes a conditional exemption. Any calculation remains RESEARCH ESTIMATE – NOT CUSTOMS ADVICE until confirmed by the importer and customs professional.4-7
6. Preserve quote-validity and allocation assumptions
Record the date, validity period, currency, quantity break, minimum order, non-recurring charges, tooling or test charges, material assumptions, allocation language, and expedite terms. A price without a validity period is not a stable model input. A lead time without an allocation or material-availability assumption is not a delivery commitment.
7. Evaluate prototype-to-production continuity
The best prototype source is not automatically the best production source, and the best production source may not be optimized for very small lots. Before release, ask how files, test assets, approved materials, component alternates, process records, and quality data will transfer if volume or supplier changes. The report contains no supplier-specific performance evidence; continuity must be evaluated through RFQs, audits, records, and actual program requirements.
8. Compare landed-cost variables, not headline unit price
Inference: Use a common worksheet for supplier price, logistics, insurance, duty, broker/customs, domestic delivery, inventory, quality/rework, and schedule exposure. Keep unknowns visible. Sensitivity-test only the variables for which a range has an evidence owner. Do not fill the worksheet with a universal freight rate, country quality factor, or assumed schedule premium.4-7
Supplier evidence closes the public-data gap
Inference: Claims about lead time, yield, on-time delivery, quality, or shortage mitigation require dated RFQs, quotes, allocation terms, audits, and performance records. Sector statistics and survey averages cannot substitute for supplier-specific evidence.14-16
This principle keeps sourcing recommendations proportional to the evidence. Country and industry data identify questions and exposures. Supplier and transaction records answer whether a particular source can execute a particular build.
The eight considerations can be implemented as one cross-functional review rather than separate procurement tasks. Engineering owns the frozen specification and alternate validation. Procurement owns comparable RFQ scope and commercial terms. Trade compliance owns classification, origin, and program qualification. Logistics owns route and service assumptions. Quality owns process and performance evidence. Finance or operations owns inventory and quantified schedule exposure. A sourcing decision becomes auditable when each input has an owner and a date.
The completed comparison should remain a dated decision record. Record the specification revision, quoted quantity, supplier and site, origin assumption, importer, HTS code, policy cutoff, route, Incoterm, currency, validity window, and owner of every non-public input. When a variable changes, update that variable rather than rewriting the original scenario. This allows engineering, procurement, finance, quality, and logistics teams to see why the preferred option changed and whether the change came from evidence or assumption.
10 – 2026 Outlook
Observed at the cutoff
As of the August 18, 2026 evidence cutoff, five observed conditions frame the sourcing outlook. U.S. tracked bare-PCB imports were lower in H1 2026 than in H1 2025. Separate broad U.S. and Canadian electronics-manufacturing indicators strengthened. WSTS semiconductor billings accelerated sharply by value. PCB and EMS statistical-program samples reported faster June booking growth than shipment growth. Tariff treatment for tracked A1 products differed materially by origin and qualification.14-710-14
| Layer | Observed at the cutoff | What it does not show | Decision use |
|---|---|---|---|
| U.S. tracked A1 trade | H1 2026 value was 2.92% below H1 2025 | PCB demand, domestic output, or full-year result | Monitor origin mix and period-matched customs direction |
| Broad manufacturing | Separate U.S. and Canadian electronics indicators strengthened | Like-for-like North American PCBA output | Use as cycle context; preserve classifications |
| Semiconductor billings | WSTS worldwide H1 2026 value accelerated sharply | Units, physical output, universal availability, or shortage | Revalidate BOM conditions; do not infer part availability |
| PCB / EMS programs | Both samples reported faster June booking growth than shipment growth | Industry census or one combined rate | Monitor multiple releases and horizons |
| Component surveys | Respondents reported lead-time and cost pressure; memory remained broadly sourceable | Universal lead-time table or supplier commitment | Trigger targeted BOM and supplier checks |
| Tariff policy | Tracked A1 treatment differed by origin and qualification at the cutoff | Permanent country rate or total landed cost | Revalidate code, origin, date, and documents before entry |
Those observations do not resolve into a single bullish or bearish index. They measure different layers. The trade result is softer; the broad manufacturing and billings results are stronger; the association programs show a June pulse but also horizon differences; and survey evidence reports pressure without universal unavailability.
Forward-looking interpretation
Inference: The combined evidence indicates a firmer but uneven sourcing environment rather than a universal shortage. Conditions may remain sensitive to product mix, BOM concentration, supplier execution, and policy timing. This is an interpretation of the approved evidence, not a numerical forecast of PCBA market growth.11012-16
The watchlist follows directly from the evidence gaps. Monitor monthly trade for changes in origin mix; official manufacturing releases for orders, shipments, and inventories; WSTS billings as a value-cycle indicator; labelled PCB and EMS program releases for several consecutive periods; component surveys for directional pressure; and tariff instruments for effective-date or exclusion changes. Revalidate supplier quotes and commitments rather than treating any public indicator as a substitute.
The watchlist should be read in layers. A change in A1 imports can prompt an origin-mix review but cannot determine whether a specific board is available. A change in QCEW or M3 can update labor or broad cycle context but cannot confirm an assembly slot. A change in WSTS can alter semiconductor-cycle context but cannot settle a part allocation. A survey can identify respondent pressure but cannot set a lead time. A tariff notice can change a dated scenario but only after its product, origin, and entry provisions are tested.
Three developments would materially change the decision context without changing the historical findings. First, a sustained change in the U.S. A1 origin profile could change where tariff and diversification work is concentrated. Second, several consecutive PCB, EMS, component, and official manufacturing releases moving in the same direction would reduce – but not eliminate – the current cross-source divergence. Third, a tariff modification, exclusion change, or expiry could alter the duty component of a future entry. None can be assumed in advance.
The buyer-level outlook should therefore be expressed as conditional questions. Are the constrained BOM items still covered by valid quotes and allocations? Does the proposed board origin match the tariff worksheet? Have freight and delivery terms been refreshed for the route and lot? Are alternate materials and components technically approved? Does the assembly supplier’s current schedule have dated support? These questions convert public context into evidence requests without pretending to forecast a market.
The observed evidence also argues for preserving optionality selectively rather than universally. Where qualification time is long or origin treatment is consequential, earlier work on alternates and documentation can reduce decision latency. Where components remain broadly sourceable and supplier evidence is current, the same controls may confirm that no intervention is needed. “Firmer but uneven” implies differentiated review, not a blanket response.
The report does not publish a numerical PCBA growth forecast. It also does not project the approved tariff scenarios beyond the evidence cutoff. A future reader should treat the cutoff as part of every policy and cycle statement.
11 – Methodology
Research design and cutoff
This report uses an evidence-first process designed to keep every material claim traceable to a curated evidence record. The evidence cutoff is August 18, 2026. Releases had to be public by that date to be eligible, although retrieval and processing could occur later. Raw files, retrieval metadata, and normalized observations were preserved so that a later audit can distinguish source content from calculation.
The source hierarchy prioritizes official statistics, official classifications, and controlling legal or tariff materials. High-quality industry statistical programs and surveys are admitted with visible sample limitations. Search-result snippets, promotional listicles, unofficial tariff calculators, anonymous charts, and unsupported supplier performance claims are not evidence.
Trade classification and version control
The project began with a PCB/PCBA classification crosswalk. Heading 8534 identifies bare printed circuits under its legal definition. A populated assembly does not remain a bare printed circuit merely because engineers call it a board. It may be classified under a narrow printed-circuit-assembly provision, the parts heading for its host equipment, or another functional provision.8
Basket A1 contains tracked bare printed-circuit lines. Basket A2 contains a narrow set of explicit national PCA lines. A2 is not comprehensive, and A1 plus A2 is not a PCBA market. Finished equipment, components, industry classifications, and services remain outside those merchandise baskets.
For U.S. trade, the analysis uses imports for consumption from USA Trade Online and preserves general imports separately. It verifies the selected lines against the applicable annual HTS editions and compares January-June only with January-June. Canadian trade uses the approved national lines and remains in CAD. National detail is not assumed to be identical across countries. Calculated annual or H1 values sum validated detail lines within one flow, period, reporter, and currency.12
Manufacturing classifications and programs
U.S. NAICS 334418 is the precise manufacturing indicator because its definition covers loading components onto printed circuit boards or manufacturing and shipping loaded boards. QCEW, the Economic Census, and M3 remain separate programs. QCEW provides employment, establishment, and wage measures; the Economic Census supplies structural output fields; M3 supplies broader current-cycle context.39108
Every use of the PRELIMINARY 2025 QCEW retains that status. Suppressed or unavailable values remain null rather than zero. Establishments retain the source meaning, employment remains a workforce measure, and output values are not relabelled as market size.
Canada’s published 33441 and the underlying broader 334410 definition include semiconductor and other electronic-component activity beyond PCBA. They are not equivalent to U.S. 334418. Canadian and U.S. indicators may be shown as separate within-series context only when the classification, period, currency, seasonal adjustment, and statistical concept remain visible.118
Statistical programs, surveys, and forecasts
WSTS data are treated as semiconductor billings by value. Global Electronics Association PCB and EMS releases are labelled INDUSTRY_STATISTICAL_PROGRAM. ECIA and Global Electronics Association sentiment findings are labelled INDUSTRY_SURVEY. A respondent percentage is not rewritten as an industry incidence rate, and a program sample is not called a census.12-16
Observed results and forecasts are separated by type and vintage. The core manuscript does not use a numerical forecast. It does not infer semiconductor units, availability, production origin, shortage, or PCBA demand from WSTS value billings.
Calculated evidence and claim grading
Each calculated claim retains its input source observations and formula. Examples include summing validated HTS10 lines within a period, calculating a same-period year-over-year change, dividing partner value by world value, or summing state employment and dividing by the national total. Calculations do not bridge currencies, incompatible classifications, full-year and partial-year horizons, or overlapping stages of production.
Candidate claims were graded before drafting. A-grade claims are suitable for executive use because they have direct, high-authority evidence and strong methodological fit. B-grade claims are suitable for the body with qualifications such as preliminary status, broader classification, program scope, or conditional interpretation. C-grade claims provide context. D-grade claims are survey observations or analytical inferences and remain labelled. Q-grade claims are quarantined from exact use.
Counter-evidence is part of the claim method rather than a separate editorial exercise. Each A-grade finding was checked against existing evidence that could weaken its scope or timing. The annual U.S. import increase retains the 2023 decline and H1 2026 softening. Stable top-five concentration retains the lower H1 HHI. The 2025 Taiwan/China ranking retains the H1 reversal. The Economic Census benchmark retains the newer but conceptually different preliminary QCEW context. The cycle sections retain softer trade, EMS horizon differences, higher inventories, and memory sourceability. These counterpoints do not cancel the primary observations; they prevent the manuscript from making them carry a broader conclusion than their measurement universe supports.
The same discipline governs qualitative transitions. A sentence that moves from observed data to procurement meaning is marked as inference when the source did not state the conclusion. Recommendations are framed as questions, inputs, and controls because the public evidence does not observe a specific buyer’s BOM, supplier, quote, or shipment.
Conflict quarantine
The June PCB release contains a source conflict: its narrative and table do not agree on the exact book-to-bill observation. No exact value is selected. The approved direction-only evidence supports the statement that book-to-bill remained at or above parity for an eighth consecutive month. The same release’s two YTD observations carry period-label inconsistency because the narrative period label does not align cleanly with the release month. The body omits those YTD values because they are unnecessary to the approved finding.13
The detailed 334418 and related product PPIs were also quarantined from headline use. They are official series, but their unusually large movements cannot be translated into universal PCBA costs or quotes under the available sample/product-mix and revision metadata.
Tariff method and raw-file preservation
The tariff matrix preserves HTS 2026 Revision 16, the Column 1 General base rate, each applicable Chapter 99 program, product-specific exclusions, special-program exemptions, effective dates, and counter-evidence from expired or announced-but-not-effective treatments.4-7 Percentages are combined only where the governing source makes them cumulative. Every stack is a dated research scenario and carries the label RESEARCH ESTIMATE – NOT CUSTOMS ADVICE.
Raw source files and manifests preserve document versions, retrieval dates, and hashes where available. Normalized observation tables retain source units, currencies, periods, adjustment status, and missing/suppressed values. The Evidence Ledger connects those records to claims, and the claim-evidence map records primary, corroborating, context, and counterpoint roles. This chain allows a final auditor to reconstruct a statement without relying on the manuscript alone.
12 – Limitations
This report supports scoped sourcing analysis; it does not close several important public-data gaps.
- A1 is not PCBA. It measures tracked bare printed circuits. A2 covers narrow explicit PCA provisions and is not universal PCBA trade coverage.
- Imports are not demand, and trade is not market size. Customs value cannot be added to domestic shipments to estimate the PCB/PCBA market. Imported inputs may be embodied in domestic output, and populated boards are dispersed across functional classifications.
- Manufacturing footprint is not capacity. Employment is not installed capacity, utilization, throughput, technical capability, or available schedule. Establishments are reporting units, not necessarily factories. Economic Census shipments are output, not market size.
- The 2025 QCEW is PRELIMINARY. It covers the selected private-industry universe, and its establishment concept is not interchangeable with the Economic Census.
- Canada is not directly comparable at the detailed industry level. Canada 334410/33441 includes broader component activities than U.S. NAICS 334418. Values also differ in currency and statistical program.
- WSTS is a value indicator. Billings do not establish physical-unit growth, fabrication origin, universal availability, broad shortage, or PCBA demand.
- Industry programs and surveys are samples. PCB, EMS, ECIA, and sentiment results do not constitute censuses or supplier-specific performance evidence. The June PCB exact book-to-bill remains quarantined, and its YTD period language is inconsistent.
- Tariff treatment is conditional. Classification, origin, entry date, customs value, Chapter 99 coverage, exclusions, exemptions, and records control the incurred treatment. The scenarios are not customs advice and should not be projected beyond the cutoff.
- Freight and lead-time evidence is incomplete. No universal public PCB freight-cost series or component-level weeks-of-lead-time table was admitted. Both remain route-, product-, date-, and supplier-specific.
- Landed cost is transaction-specific. Public indexes, wages, and exchange rates provide context, not automatic quote pass-through. Quality, rework, inventory, and schedule exposure require explicit data and methods.
- Supplier performance is not established. The evidence does not rank suppliers or countries by yield, quality, speed, on-time delivery, or shortage mitigation.
The analysis also has time and coverage limits. The 2026 trade and current-cycle results are partial-year or monthly observations, not completed annual outcomes. The cutoff freezes the evidence and tariff state as of August 18, 2026; it does not assert that later releases or policy changes will match the report. The partner and state rankings depend on published classifications and disclosure treatment. Blank or suppressed observations are not converted to zero.
Prototype and low-volume activity is not a standard segment in the admitted official datasets. The report can frame procurement considerations for those buyers, but it cannot estimate their market size, order volume, average price, or share of industry output. No public dataset admitted here identifies a universal prototype lead time, lot size, yield, or cost structure.
The evidence is also strongest at different levels for different questions. Trade and manufacturing structure have official statistical coverage. Component conditions rely more heavily on public survey summaries. Landed-cost execution variables depend on buyer, supplier, broker, and logistics records that are outside a public industry dataset. Confidence should therefore follow the claim grade and source type rather than the visual prominence of a chart.
These limitations are not footnote formalities. They define the boundary between an evidence-supported sourcing decision and a claim the public data cannot carry.
Source Notes
1. U.S. Census Bureau, USA Trade Online: Reimagined, official CSV export for U.S. imports for consumption of the seven validated Basket A1 HTS10 lines, annual 2021-2025 and January-June 2025/2026 data; June 2026 trade release dated August 4, 2026, USA Trade Online report builder. Cyrionix calculations sum the seven validated lines within each period; annual values are not added across years. Origin shares equal partner value divided by World value; top-five shares sum the five leading partner values; HHI sums squared partner shares. Retrieved August 19, 2026 from a release eligible at the cutoff.
2. Statistics Canada, Canadian International Merchandise Trade, five validated Canadian Basket A1 bare printed-circuit import lines, 2025 and January-June 2025/2026; release dated August 4, 2026, CIMT application and methodology. Values remain CAD. Cyrionix calculation sums the five lines within each period; year-over-year change compares January-June with January-June. Retrieved August 19, 2026 from a release eligible at the cutoff.
3. U.S. Census Bureau, 2022 Economic Census Manufacturing: General Summary Statistics, national NAICS 334418 row, EC2231BASIC, released December 5, 2024, 2022 Economic Census manufacturing tables. Source monetary fields published in thousands of dollars were normalized to USD. The data are a 2022 structural benchmark, not current 2026 output or market size.
4. U.S. International Trade Commission, Harmonized Tariff Schedule of the United States, 2026 Revision 16, archive label dated August 14, 2026, HTS archive and Revision 16 CSV. The scenario uses the published Column 1 General base rates for 8534.00.00.20 and 8534.00.00.80 and the relevant Chapter 99 provisions at the August 18 cutoff.
5. Office of the U.S. Trade Representative, China Section 301 List 3, 83 FR 47974 as amended, official tariff list PDF; Extension of Product Exclusions Through November 9, 2026, published December 1, 2025, official extension PDF. The product-description exclusion cited in the research record is specification-dependent and was recorded under U.S. note 20(vvv). A tariff-line match alone does not establish exclusion eligibility.
6. Office of the U.S. Trade Representative, Forced Labor Section 301 Final Action, 91 FR 47318, published July 28, 2026 and effective for covered entries beginning July 24, 2026, official Federal Register document. Scenario treatment retains origin, product coverage, Chapter 99 provision, exemption, entry date, and cumulative-duty conditions.
7. Office of the Federal Register, Imposing a Temporary Import Surcharge to Address Fundamental International Payments Problems, February 25, 2026, Federal Register document; The White House, Executive Order 14389 Ending Certain Tariff Actions, February 25, 2026, official PDF; and U.S. Department of Commerce/USTR, Implementing Certain Tariff-Related Elements of a Trade and Security Agreement Between the American Institute in Taiwan and the Taipei Economic and Cultural Representative Office in the United States, May 28, 2026, Federal Register document. These sources prevent expired, terminated, or announced-but-not-effective treatment from being carried into the August 18 scenario.
8. U.S. Census Bureau, 2022 NAICS, industry 334418, Printed Circuit Assembly (Electronic Assembly) Manufacturing, official NAICS detail; Statistics Canada, NAICS Canada 2022, industry 334410, official classification detail; and U.S. International Trade Commission, Harmonized Tariff Schedule, heading 8534, HTS search. These systems classify different objects: establishments, industries, and traded products. U.S. 334418 and Canada 334410/33441 are not equivalent industry-size measures.
9. U.S. Bureau of Labor Statistics, Quarterly Census of Employment and Wages Annual Averages, private-ownership NAICS 334418 national and state files, 2021-2025, QCEW downloadable data. 2025 data are PRELIMINARY. Cyrionix calculations compare 2025 with 2021 and sum only published, unsuppressed state observations for rankings. Establishments are reporting units; employment is not capacity.
10. U.S. Census Bureau, Manufacturers’ Shipments, Inventories, and Orders (M3), June 2026 report and historical NAICS workbooks, released August 4, 2026, M3 data. Cyrionix calculations compare sums of January-June 2026 seasonally adjusted observations with January-June 2025 for the same published series. M3 categories are broader than PCBA.
11. Statistics Canada, Monthly Survey of Manufacturing, Table 16-10-0047-01, June 2026 release dated August 14, 2026, monthly manufacturing table. Cyrionix calculations retain the source classification and adjustment status and compare January-June 2026 with the same 2025 months. Canada 33441 is not equivalent to U.S. NAICS 334418.
12. World Semiconductor Trade Statistics, WSTS Historical Billings Report – June 2026, published August 10, 2026, historical billings workbook. Cyrionix calculations sum monthly billings for January-June and compare the same months year over year. Billings are revenue/value indicators; shipment region is not production origin, and the data do not establish unit growth, availability, shortage, or PCBA demand.
13. Global Electronics Association, North American PCB Statistical Program, “PCB Industry Momentum Continues: 12% Shipment Growth and Strong Book-to-Bill,” July 28, 2026, June 2026 PCB release. INDUSTRY_STATISTICAL_PROGRAM. The manuscript uses the separately labelled June shipment and booking growth rates and the approved direction statement only. The exact June book-to-bill is excluded because the release contains a source conflict; two YTD observations also carry period-label inconsistency.
14. Global Electronics Association, North American EMS Statistical Program, “North American EMS Shipments Rise 6.7% in June; Book-to-Bill Reaches 1.33,” July 29, 2026, June 2026 EMS release; and “North American EMS Market Opens 2026 on a Soft Note as Momentum Cools,” February 26, 2026, January 2026 EMS release. INDUSTRY_STATISTICAL_PROGRAM. Public percentage and ratio indicators describe the program sample, not an industry census.
15. Electronic Components Industry Association, Industry Pulse ECST Executive Summary – July 2026, published July 31, 2026, public executive-summary PDF. INDUSTRY_SURVEY. Percentages describe respondents reporting lead-time direction; they are not a universal component lead-time series or supplier commitment.
16. Global Electronics Association, Sentiment of the Global Electronics Manufacturing Supply Chain, “Electronics Manufacturing Demand Holds Firm as Cost Pressures Intensify,” March 19, 2026, public survey analysis. INDUSTRY_SURVEY. Memory sourceability, availability/lead-time, and price observations are respondent percentages and do not establish universal incidence.
17. U.S. Bureau of Labor Statistics, Producer Price Index series PCU3344--3344--, not seasonally adjusted, data published August 13, 2026, BLS Public Data API. Cyrionix calculations compare the January-June 2026 average with January-June 2025 and June 2026 with June 2025. The broad industry-group index is not a PCB/PCBA quote, cost, margin, availability, or import-price measure. The anomalous detailed 334418 and related product-series changes are not published as headline statistics.
18. Board of Governors of the Federal Reserve System, H.10 Foreign Exchange Rates, monthly averages through June 2026, H.10 current release and data. Exchange-rate changes are exposure indicators; contract currency, hedging, input content, and commercial decisions determine pass-through.
About the Research
Published by Cyrionix.
Research evidence cutoff: August 18, 2026
This publication preserves the audited evidence boundaries, qualifications, and source notes of the approved manuscript.